Best ideas focus: Walmart
I get out of hospital Monday! Yay! Let's celebrate with the first of a new series of single stock ideas where we pick up a Yabby favored name and get down and dirty.
I have been doing portfolio management in one form or another for nearly thirty years. Here are some simple lessons drummed into me over time.
Pay attention when the market responds positively to earnings
Pay even closer attention when the change signals a turnaround
Don’t be too greedy to take quick profits when a company has momentum
There is flip side to this when the direction of travel is opposite.
I will pick some examples in the ASX battery minerals sector in forthcoming articles.
For now, let us focus on the positive and pick some stocks that were standouts from our prior post-election survey of sentiment in the US market.
To the front stage of Yabby screening for robust sentiment we are now going to get down and dirty with fundamentals and peer group analysis.
This will be only slightly contrarian in that our target Walmart XNYS: WMT is neither cheap nor out of favor. However, we will consider to what degree the company has made progress in ecommerce versus its arch-nemesis Amazon XNAS: AMZN.
The value of a well-diversified portfolio
One challenge of building concentrated portfolios of fifteen to twenty-five stocks is the risk management from being overexposed to one or more sectors.
Diversification across economic sectors helps to mitigate this.
In the global context, diversification by country of risk and currency also helps.
In this note, we look briefly at sectors and how I think about them.
Animal, vegetable or mineral?
In finance, economic sectors are often treated as some kind of “stone tablet” that came down from the Gods. They are rarely explained, and often obscure.
In my experience, there is tremendous value in a sector system that relates easily to underlying economic trends, so that one can reason effectively.
The thematic sectors I use are based on four elements of economic activity.
This would work just as well for classifying a Stone Age economy, or ours today.
Human activity serves human needs and wants for consumption.
Some of this activity is fed from the products of the natural world via resources.
In preparing consumer items, like a freshly killed Mammoth, there are intermediate activities that can be considered as amplifiers or helpers to social activity.
A caveman might use a flint axe to carve up the Mammoth, an example of technology.
Another might use round wooden logs to roll a hearth stone into place for a campfire.
That is a primitive example of infrastructure to facilitate trade and transport.
In total, these four basic kinds of activity, resources from nature, consumer needs and wants, with enablers from ingenuity, like technology, and infrastructure will do.
Of course, this is a pretty naive and coarse classification of economic activity.
To fix this problem, we can subdivide each category further.
I use eight categories, with each stock assigned to one. I won’t go into the detail of how exactly I do that. It is based on a set of rules using the company activity.
Resources is split into food versus minerals and energy.
Consumer is split into needs, like healthcare, and wants like automobiles.
Technology is split into digital, of data, versus analog, of stuff.
Infrastructure is split into financial, such as banking, and physical, such as real estate.
In the diagram below, I have used a color wheel metaphor.
This is not perfect but makes some basic sense with opposites. Food is primarily a consumer need, while resources are used to make consumer goods.
Within the consumer area, needs are more defensive than wants.
You can reason with these categories more easily than a traditional naming.
The above document has more details if you are interested.
Mapping the market and position sizing
Aside from reasoning about where we are in the economic cycle, the value of these categories is to help map the market and to manage exposure risk.
You could pick great stocks but have too much or too little allocated to them.
Choosing how much of each sector and stock to own can make a difference to the performance outcome and will certainly impact the risk of your portfolio.
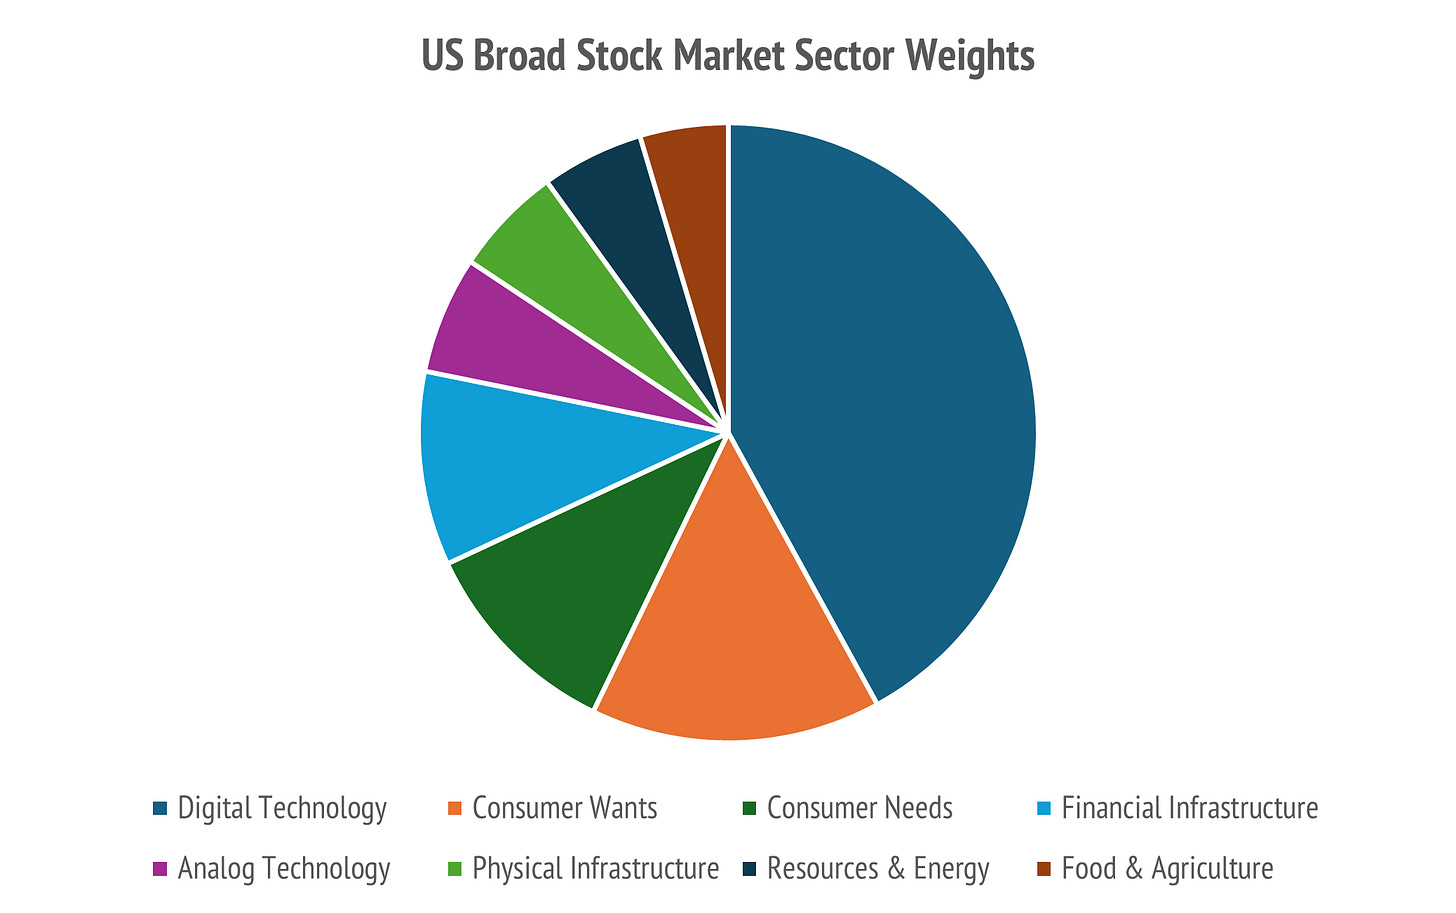
Here is a pie chart of sector weights for the broad US stock market (2300 stocks).
Note how dominant the Digital Technology (DT) sector has become.
It is 42% of the current market weight!
Probably, there are many investors who are underweight this sector because that is a very high proportion of the portfolio to have in just one sector.
It is worth looking at the numbers in more detail, and estimating the number of stocks you would need to own for an equal weight portfolio.
Doing this analysis can help you figure out what is a sensible split of your portfolio allocation by size of position, and number of stocks that you own.
For the most part, the budget looks to be one or two stocks from each sector, with more in Digital, upwards of perhaps six to eight.
In this article, we look at Consumer Wants, so we have a budget of two names for a concentrated fifteen stock US portfolio.
Keep reading with a 7-day free trial
Subscribe to The Savvy Yabby Report to keep reading this post and get 7 days of free access to the full post archives.


