


While we had a great year with our Australian 20 Stock Model and a so-so year with our US 20 Strock Model, we had a frightful year for the International 20 Stock Model. The full story is below, but the short version is that China technology tanked.
The performance numbers for Australian FY2026 were:
Portfolio: +2.46%
FTSE Global All Cap: +24.70%
Alpha: -22.24%
There is no polite way to state that result other than to recognize it as terrible.
The rest of this report digs into that performance and outlines our response.
The effect on our track record is to render it so-so since inception.
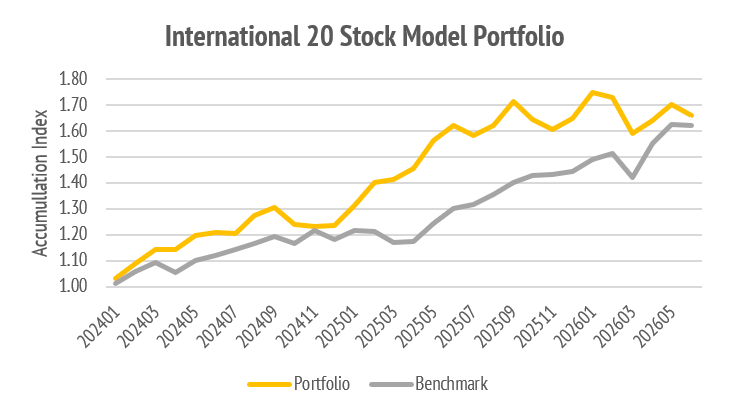
Around May-2025 was the time to crow, now we have to eat the crow. Run, Mr Crow!
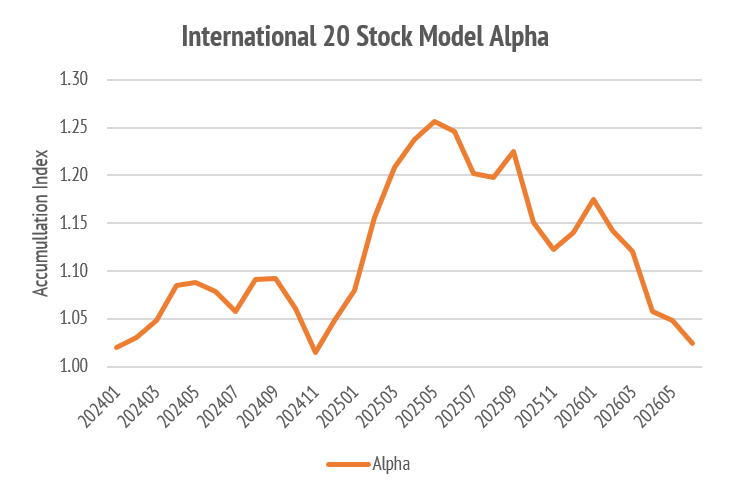
There is a deeper issue to report here, and I will elaborate, but you will notice from the graph of cumulative outperformance that it is quite volatile.
Up, down, up more, down more.
The first instinct, when faced with terrible results, is to throw out the bad and ship in the good, in order to address the cause of the trouble and turn the ship around.
This is not a terrible approach to investment management but can be hazardous when running global portfolios. There are two reasons for my caution:
Benchmarks are subtle creatures in global investment because of what they hide.
Turnover is the enemy of after-tax returns and prone to mean reversion drag.
Let me return to what happened in late 2024 and what we did about it.
On 4-Oct-2024, in the midst of declining alpha, we did this rebalance
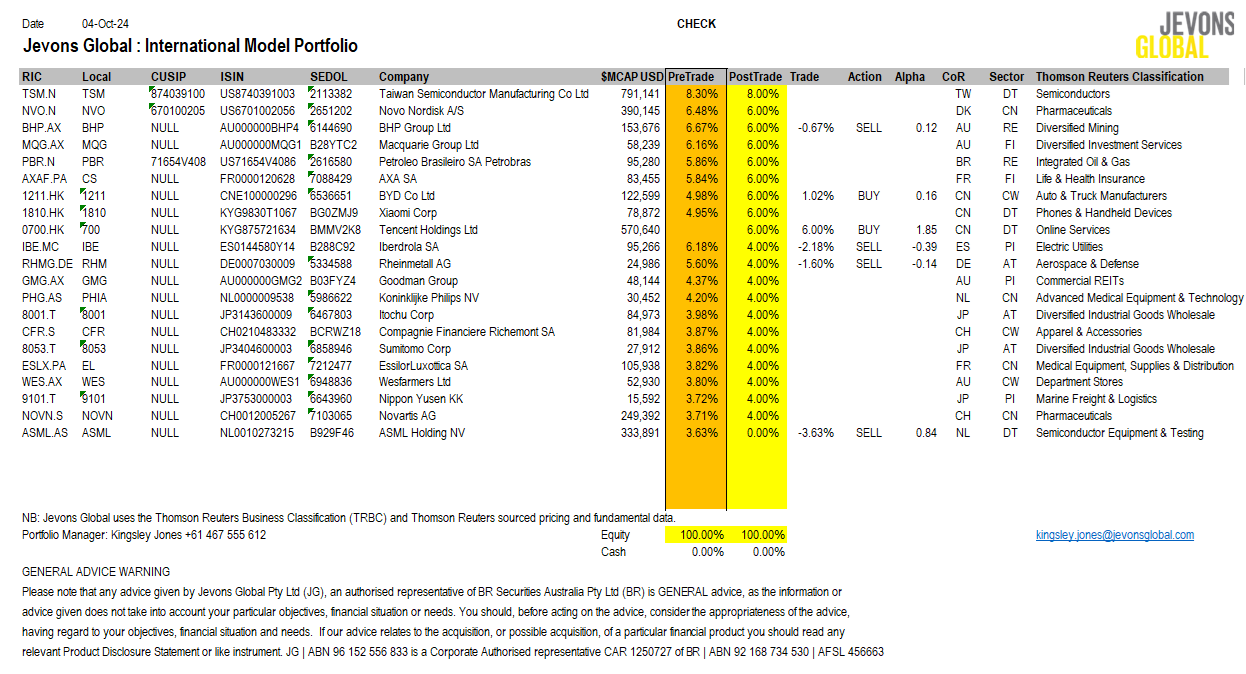
The heroic changes made then were to ditch semiconductor equipment firm ASML Holdings XAMS: ASM, and to buy Tencent Holdings XHKG: 700. They both did well, although Tencent did well earlier, and ASML later. Later it did very well indeed.
That was the only rebalance until 30-Jan-2026, fifteen months later.
Over the next six months, that portfolio rebounded 23.8% in alpha terms.
This is not an isolated experience for me and is one of the key challenges I had to overcome when first managing global portfolios.
It has to do with mean reversion.
The Power of Mean Reversion
This is supposed to be an educational blog about portfolio management.
Of course, I want to provide good advice and suggested investments, but I also want to step away from what I personally think about any stock, at any given time, which is a hugely fallible undertaking, and impart what I have learned about the generalities.
There are a number of maxims I am sure you have heard:
Cut your losses and let your winners run.
Nobody ever went broke taking a profit.
No stock is ever too high to buy or too low to sell.
Buy a good stock and wait till it goes up, if it don’t go up don’t buy it.
The stock market transfers money from the impatient to the patient.
You can probably recognize a few famous investors in among that lot.
It is the last aphorism that I will rap on in this note.
When things go wrong, pay attention to the timescale of measurement, and the features of how you choose to measure return and ascribe your judgment.
In explaining exactly why global portfolio management needs to be treated with respect, when making judgments on what to buy and what to sell, it helps to be familiar with the statistical forces at work in return measurement.
This can be a very sobering experience for anybody who considers their results to be good on the basis of a short time series. The nature of the mathematics that I will relate highlights that we may none of us live long enough to prove we are good.
The consolation prize, for all global managers, is that if your tracking error to how you are measured, via your benchmark, is large enough, it is next to impossible to declare that you are most definitely bad. This is with one exception, absolute return.
Once we are through this discussion, it will be a little easier to understand why I make the changes to the portfolio as I do: not a lot of panic; a decent measure of hope.
If your absolute return remains positive, and the portfolio is well-supported by value, then you can hope for better times ahead. You should hope for mean reversion.
The hope in question is not idle, but the outcome is not guaranteed.
We none of us know the future, which is why we bet on statistical odds.
The odds are that bad times in markets are followed by good times.
Is this deliberate neglect? Not really. It is casual confidence.
I am confident that evident value will be bought.
If I think it has been bought by me, I do hope that others buy it.
However, it pays not to be reckless. Step into your evident hopes of recovery by stages and do not bet the farm by swinging for the bleachers. Husband those positions that are doing very well but be prepared to trim them.
The idea is to allow a three-to-five-year value cycle to play out for you.
This is not possible through frenetic trading.
The three-to-five-year cycle demands low turnover.
Specifically, if you intend to hold for three to five years, you should mark your ideal turnover budget as implying a 36-to-60-month turn, in and out.
Let us work that out explicitly:
36 Month Average Holding: 100%/36 = 2.78% turnover per month
60 Month Average Holding: 100%/60 =1.67% turnover per month
This is not very much and certainly does not mean you can dump a 3% minimum new holding size every month. This month, as seen below, we will be 3.46% turnover.
Turnover is a little higher than our budget to take advantage of value on offer.
For those investors not used to daily measurement, which is most, this can seem like an agonizingly slow response to a rapidly changing world.
Indeed, it is a purposefully slow, stubborn, and tortoise like discipline of creep.
The mean reversion of value is slow burning and demands patience.

You may wash your hair every day, but Rachel Hunter hair takes time to happen.
I look at it this way…
With a schtick like that, value investors can holiday in the sun with no phone.
Let us hope it turns out okay, with all the snappy moves of this here tortoise.
Understanding Benchmark Tracking Error
Leaving aside the schtick, the obvious question to ask is this:
Is 20% positive or negative alpha good or bad over two-and-a-half years?
Easy, says marketing:
20% positive alpha over two-and-a-half years is good.
20% negative alpha over two-and-a-half years is bad.
So true, and yet so unhelpful to any real investor.
Up is what we want, down is what we don’t want.
Yes, Mr Marketer, we do know that in portfolio management.
The problem, for any investor, is what to do when it goes up, or down.
Do I sell all of the losers if it goes down?
Do I buy all of the winners if it goes up?
The real problem is that much of what happens is statistical noise.
If you have a normally distributed random variable with a constant mean, and constant standard deviation, the estimation error of that mean, goes down as the inverse square root of the number of periods in the statistical sample.
Let us now look at the track record for this strategy.
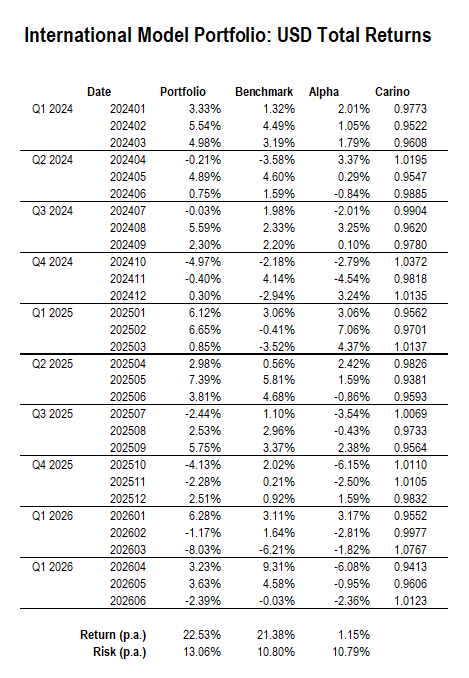
When you invest in global markets, there is a wide variability of outcomes due to the sheer number and variety of stocks and markets involved. This shows up in a measure called the tracking error, or relative risk, of the strategy.
In the 30-month performance record above, the annual average alpha was 1.15% on a total risk of 13.06%, and a relative risk, measured versus the benchmark, of 10.79%.
Assuming the returns were generated from a stable distribution, which they are not, we would need to wait about 100 months to express confidence, that our generated alpha is positive (the statistical uncertainty is circa 10.79%/10, the square root of the number of trials, at 100). That is the one-standard deviation estimate.
For 30 months, the naively estimated uncertainty in alpha is 1.96%, and that at the level of one-standard deviation, or 68% for that standard confidence interval.
To put this in the proper context, standard statistical analysis would show that you need to wait roughly 900 periods, or 75 years, to have 99% confidence in your estimate of the alpha to 1% precision with a 10% relative risk.
Did I choose things that way just to mess with your head?
Not really, it is a feature of global financial markets. This benchmark is the FTSE Global All Cap Index, measured in USD, like our portfolio, which has 60-65% US stocks. This happens to be the benchmark we chose, because the Vanguard ETF AMEX: VT tracks the same benchmark, and can be bought very cheaply for 0.06% MER.
There are no US stocks in our International 20 Stock Model Portfolio.
We should expect this model to behave accordingly.
When the USA has a knockout quarter, we will underperform.
This is not an excuse but a caution. Whenever you are evaluating global markets be aware that the tracking errors can be very large indeed. This is why it is hard.
I mean hard for everybody not just hard for me.
For instance, the South Korea ETF ARCA: EWY is up 87.97% Year to Date (YTD).
You can go crazy, and many do, madly switching in global markets.
This is not what I do because I learned my lessons long ago. Whenever, the markets move wildly against you, in this global sack race, look carefully for the value.
The Characteristic Time Scales of Market Action
Every single day that the global market is open, there is money sloshing back and forth looking for a return. These flows will move markets all by themselves.
Therefore, we must be cautious, and a little circumspect, on attributing too much of a real signal to the back-and-forth of daily flows and the incessant chatter.
There are stories told the whole time.
Some are true, some not so true, some might prove true one day.
Others express the value of a good story to attract money.
In the short run, you can be confident that a good story will attract money, and the validation of that story is how much money it can attract right now.
This is why chasing momentum works on a three-to-twelve-month horizon.
I have not done that back test for years, but I warrant it is still true.
The opposite strategy works well over periods of about one month.
The so-called residual reversal strategy is the best quantitative signal known to man.
Generally speaking, you can bet on the losers of last month reversing.
The other timescale of statistical significance is the three-to-five years reversal.
Investor neglect sees many losers become winners over three to five years.
This is the source of most investment alpha for so-called value strategies.
Recognize that I have nominated three key time scales and a dominant modality.
Mean reversion and reversal of returns over about one month.
Continuation of price trends over three to twelve months.
Mean reversion of a much greater scale over three to five years.
The earlier turnover mathematics highlighted that there is a cost to playing any of these sweet spots as your source of investment return.
The reversal strategy over one month is very high turnover, 1000%+ per year, and so only suited to those with low transaction costs, whose income is from trading.
These are the market makers, Commodity Trading Advisers (CTA), broker proprietary trading desks, and a good chunk of quantitative hedge funds trading signal.
The three-to-twelve-month trend play suits full bench fundamental funds managers who have sold their investment chops on their ability to forecast quarterly earnings.
This is a 100% to 400% turnover proposition that supports high volume marketing to garner assets because investors love to hear a timely update on market stories.
The final three-to-five-year strategy suits those with a high tolerance for short-term pain, the ability to defer the pleasure of long-term gains, and a taste for deferred capital gains as their primary engine of personal wealth creation.
This generally does not market well which is why proponents are characters.
People listen to Warren Buffet because of who he is, not what he does. They do come first for the returns, but they stay for the homespun philosophy, and the anecdotes.
The rational value investor dispenses entertainment to soothe current pain.
This is not silly, or fatuous, since any value investor worthy of that name will make many mistakes in their career, and experience an awful lot of personal pain.
This is the kind of pain that breeds a stoical cast of mind to misfortune.
You know the schtick:
That which does not kill us will only make us stronger.
Provided that one is pragmatic, suitably cautious, and willing to label spades as spades, when all other monikers have been deployed, you are good to go!
On to what we will do, this month, which is not very much.
