

Global Themescape: Jupiter
Some businesses serve our need to avoid bad outcomes. While not pessimistic by nature, humans will buy services to offset a rainy day. Insurance and healthcare.

The Artificial Intelligence Oracle of Google Gemini offers this pith on pessimism.
In astrology, Saturn is often associated with pessimism, particularly when negatively aspected in a birth chart. This association stems from Saturn's role as the "taskmaster," bringing lessons, discipline, and karmic challenges. A negatively influenced Saturn can lead to feelings of restriction, fear, and self-doubt, hindering progress and creating a sense of hopelessness.
The avoidance of bad outcomes has an enduring resonance with people.

Obviously, any product or service that involves discipline, like buying life insurance, or paying for healthcare is a positive expression of planning to avoid bad outcomes.
This is natural defensive behavior, and likely to remain active in a downturn.
People will buy such goods and services in any market, but we are more likely to do so when there is a clear and present concern before us.
In my earlier piece, Global Themescape: Mars, I introduced a segmentation principle that is commonly used in the analysis of consumer behavior and preferences.
Henceforth I am going to call this the principle of investor psychographics.
Investor psychographics refers to the study of investor behaviors and preferences based on psychological factors like values, beliefs, attitudes, and lifestyles. It's a way to understand why people make certain choices and to segment investors based on shared psychological characteristics.
You will notice that I am a common thief, like the artist Pablo Picasso.
I substituted the word “investor” for “consumer” in the standard definition of the term consumer psychographics and pretended that it would work out the same.
If only life were that simple!
In reality, things are more complicated than this. The state of mind of investors is dynamic according to their need. Investments are different from your standard consumer product like sliced bread, or commodities like potatoes.
Investments have a lot in common with luxury goods in that demand can go up when the price of the investment rises. These are so-called Veblen goods. People view price as if it were an indicator of quality and so chase goods with rising prices.
This is why premier luxury brand Hermes raised prices in a climate of slowing demand and tariff threats for imports to the USA. If fewer folks can afford to buy the product, then a higher price is justified to underscore scarcity value. That is a Veblen good.

As I wrote at length in an article on Financial Literacy, nobody really needs a jewel encrusted skull by British artist Damien Hirst called For the Love of God.
For the Love of God sold for £50m, having cost £14m to make.
Nobody actually needs it. Rumor says the Artist himself owns it, in a syndicate.
Why mention this in connection with stocks?
Rational economics says that markets are efficient and that investors will sit down and properly value every investment as a series of properly discounted forecast cashflows.
Then they go buy a meme stock like Gamestop.
When investors will behave rationally, and when they won’t, is one of the greater mysteries of financial markets. What gives? Why the mercurial changes?
For instance, stocks may behave like Veblen Goods when the price is rising, but they behave like anti-Veblen Goods when the price is falling. The Demand to Buy can go up with rising price, but the Demand to Sell can also go up with falling price.
What happens in any given state of the world is complex and nonlinear.
That is properly the subject of behavioral finance.
Linear quantitative investment models
As regular readers know, I have a quantitative finance background. This involves building mathematical models to rank stocks by prospective return.
Here is a late 1990s era bible of quantitative portfolio management.
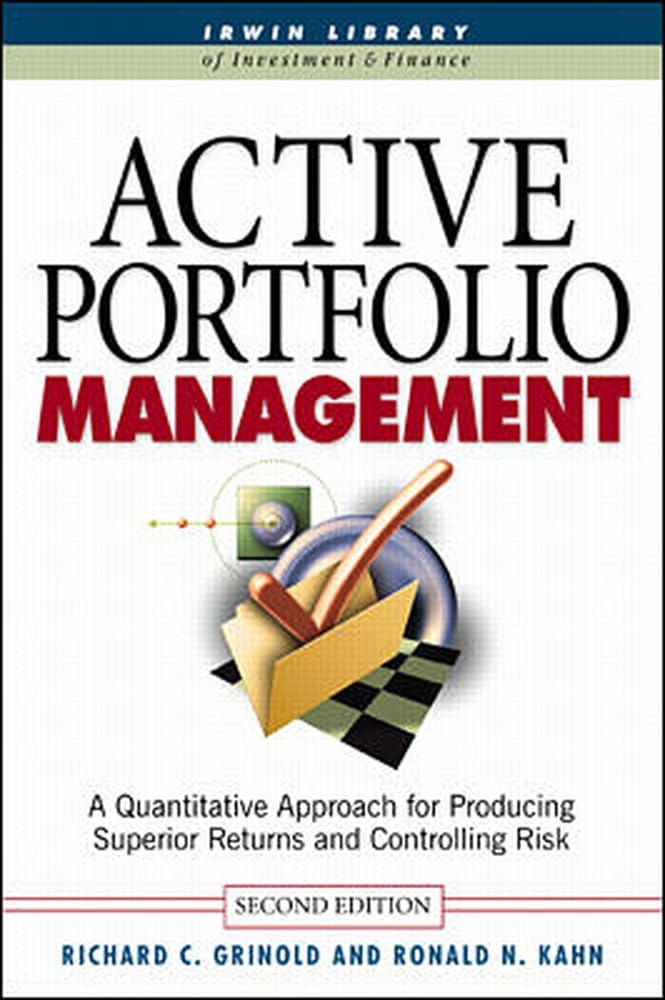
When I entered the profession, around 1996, Grinold and Kahn was the bible.
I actually met Ronald Kahn once in San Franciso at the then shop of Barclays Global Investment (BGI), due to having a connection there with a former colleague.
He was a very interesting and thoughtful guy with a physics background.
I remember some of the conversation, the part that bothered me was all the models used were linear, meaning if you doubled the input, you doubled the output.
He understood the thrust of my question but explained that finance was not like physics (which is true), and that nobody knew how to build nonlinear models.
The quantitative investment models at BGI were very good models.
My former colleague who worked there made a lot of money, started his own hedge fund, and probably plays music with a Bay view now, since that was his first love.
The firm BGI got carved up and sold in the Global Financial Crisis.
There is an Australian firm called Vinva, which has many of their former leadership team from the down-under operation. They are very good. Quality firm.
Nonlinear quantitative investment models
I stayed in Australia and thought about nonlinear quantitative factors a lot.
This can be a lonely enterprise. Although Australia produces many fine quantitative finance researchers the local market is shy of buying such funds. Quants usually see sense and go overseas. I am a local feral animal, I stayed home.
I find it strange that Australia never fully embraced its own quantitative talent. You see this is the market which has probably the first fully documented quant model.
I do much work in the National Library of Australia, the Mitchell Library in NSW, and the ANU Menzies Library, in a pastime I call financial archeology.
This field is young, and I am one of a handful of people who do it worldwide. Here is one of my proudest archaeological finds from what I call the Menzies Crypt at ANU. This is a part of the library where the microfiche machine lies. It is cold there.
Provided you pack a leather jacket, a scarf and a Fedora, you will stay warm.

I digress.
The screenshot is Australia’s first documented quantitative finance model. This was the STATEX model developed at the Sydney Stock Exchange.

The STATEX model was made possible by the digitalization of the exchange back in the 1960s. They still had a chalk board for the market, but they had computers for back-office settlement. The research team used these to run the ranking models.
The first model release was around 1971, but it died in the early 1980s due to lack of investor interest. Australia had good quality financial pricing data back then, due to STATEX, but most of it was lost when the service shut down. That was a tragedy.
It was not a world first, which honor really goes to the Babson chart service, which got going around 1904 in Boston, in the USA. Roger Babson predicted the Crash of 1929.
It may be difficult to comprehend today, but Roger Babson invented business cycle analysis and used industrial production charts to track progress.
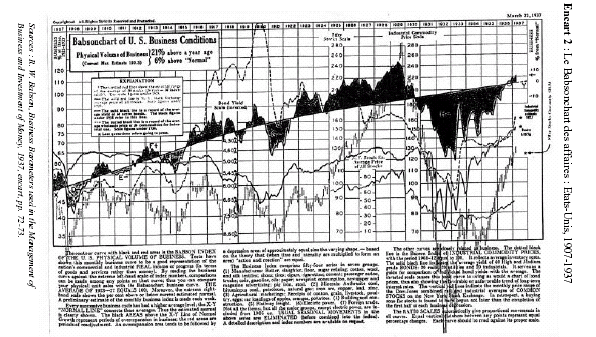
This was an early example of a nonlinear forecasting model.
The important points were turning points, and crossing points, taken to be an indicator in the changes in the business cycle, from expansion to contraction.
In the middle of the Great Depression, the US government was so concerned by the evident inability of the business community to see what was coming next, that they set up the National Bureau of Economic Research (NBER) to study business cycles.
This remains the foremost research agency of its type globally.
Business cycle analysis is inherently nonlinear.
Remember that.
The mind of the market
The rationale for cycle studies is that the financial market is like a goldfish. It has no memory beyond one cycle, after which it forgets everything, only to do it again.
The half-life of financial memory is less than ten years but greater than five.
Over thirty years, the proportion of surviving goldfish in the market, is somewhere between (1/2)^3 = 1/8 and (1/2)^6 = 1/64. Say there were a thousand people who entered the Australian investment market in 1996. Now there are 16 to 125 left.
Hi folks! I know most of you, but not all. The number 30 seems about right.
This may be one reason why investing has been called The Minority Game.

This is very counterintuitive, but a staple of Contrarian Investing.
The core idea to grasp is not when the crowd is right or wrong, but under what conditions the crowd is most likely to want to change their view enmasse.

There is no “magic signal” that tells the Wildebeest when they need to cross the river in the annual migration. However, cross the river they will, in a great crowd.
The crocodile in this game is the minority that eats a meal of Wildebeest.
The problem for factory owners, or portfolio managers, is that all positions are taken on the basis of a prior forecast, which is usually a trend. When the trend bends it is done and some prior decisions, the ones that have long lead times, were wrong.
Since I have spent time as part of the portfolio management team of some very large firms, I can tell you just how long it takes to reverse a prior decision to buy.
For the solitary investor this may seem surprising, but it could take us three months to buy a stock and another three months to sell the stock. In between, we would aim to hold that stock for three to five years to make a solid return.
The point is that the switch from a Bull market to a Bear market takes time.
Large firms have the advantage of many wise heads who have seen it all who know how best to disguise their intentions while changing their portfolio.
Long experience in markets is a minority game.
Few have such experience.
Smaller investors are the minority, by percentage value of holding.
This means they have the advantage of being able to get in and out quickly.
This is a minority game because you are trying to cross a river in a crowd.
The best time to cross the river, paradoxically, is when the river is quiet, and there are no crowds about. In Bear rallies, this is after the market went up and volume fell.
Traded volume is a nonlinear signal of trading urgency.
When people are really desperate to buy or sell the volume goes up. No volume is bad since then you cannot trade. Falling volume after rising price is when to sell.
When a large pension fund is selling their NVIDIA stock, like all of it, they will do this day after day. They are trying to hide their selling in among the chaos.
I used to head quantitative trading research for a $400B equity book.
This is how we would do things.
People always ask when the right time is to buy or sell.
I cannot tell them that, but I can tell them what to look for.
Due to the general collapse of knowledge and expertise within the finance industry many old rules of thumb are forgotten. This is made worse by new entrants who do not understand why traders look at certain chart quantities like volume.

Look at the above chart for Apple XNAS: AAPL. I sold my final stake at around $198 after writing my piece The gift of a Bear rally. The rationale for this was twofold:
The Apple supply chain will be severely stressed by Trump tariffs
Apple was rising to meet cost-basis from below and failed to hold above
The first reason relates to a judgment of likely deteriorating fundamentals. We do not know these for a fact; it is a reasoned and informed forecast.
The second reason relates to a calculable fact of deteriorating sentiment. We do not know for sure how changing sentiment will affect trading, but we know it changed.
When I put the two together, I took a decision to sell.
I don’t know if this will work out as intended, but that is where experience comes in. Since I have done thousands of trades, some in GFC conditions, it felt right.
Actually, this does not do justice to the value of close study of a stock chart.
Notice that volume spiked massively in the “V” down, which is when you do not want to be selling. However, once that selling dried up, buying was sustained by bargain hunters and short covering from hedge funds. Volume then faded.
Experienced traders, in large funds, are harvesting the up volume to unload, and then pulling back when the price starts falling. Then the volume dies off again.
Volume will rise once more, most likely on the next down leg.
Since Apple is about 11% of the S&P Global 100 IOO ETF, you can imagine it can take a while to unload a position. Warren Buffet sold 70% of his stake over the past year.
I am sharing this information not to make anybody feel foolish or in some way unaware of the real game being played. I am sharing it to empower you.
Why Saturn?
Now we come to the kicker and a Bear market buy idea.
I thought it would be fun to steal the astrology interpretation of planets, in the context of human emotion, to illustrate a simple idea.
Psychographics is the classification of stimuli by common affect.
I do not mean “effect” because this is not a statement of the physical sensation.
I mean “affect” which is what psychologists use to describe the mental sensation.
In a Bear market, the short-term correlation of stocks goes to one, meaning that they all move together and in the same direction. Mostly, you do not want to trade then.
However, outside of this condition they can be moving apart.
This is happening a lot right now in ways that are very challenging to experienced market players. For instance, the MSCI Emerging Market ETF EEM is up against the Standard & Poors S&P 500 ETF SPY. This is not supposed to happen!
The US Dollar is also down versus other big currencies like the Euro and Yen.
This can happen and is consistent with Emerging Markets doing better than US Markets. However, that usually happens coming out of a major US Bear market.
Something has radically changed, and most traders are perplexed.
The usual rules of behavior seem to be perfectly upside down.
The psychology of what goes together in which direction is inverted.
Gold is going up while the US dollar goes down, US bonds go down and US stocks go down. This is not unprecedented, but it is a complete change of market tone.
We have had a stonking good bull market in the USA for a decade and a half.
The Rest of the World has been indifferent, at best.
Now money is leaving the USA and that falling tide stateside is raising all boats on distant shores, across the Atlantic in Europe, across the Pacific, in Hong Kong.
What on Earth changed to produce this seismic event in market preference?
I guess it may have been Liberation Day, and the antics of this man.

President Donald J. Trump has a right to be who he is.
Global markets seem to have decided to let bygones be bygones and leave.
There is a lot of chaos in the “Executive Order” program of President Trump.
Normally, I would say legislative program, but that would involve Congress.
President Trump seems to prefer executive power to legislative power. This is not unknown in the US Government, but it is now pursued to an extreme degree.
You may not need to burn down the Reichstag to make it go away.
Just sign the EO: “Be gone with you Capitol!”

Nations can recover from missteps and failures in governance, but investors may not hang around to find out if and when everything returns to normal.
They may just sell on rising prices when there is sufficient volume.
Just rinse and repeat until you have your money in Switzerland or Singapore.
Saturn is the planet of melancholy.
See why I picked that one.
Never fear, astrology is a robust industry that markets each planet for every occasion. Saturn is also the taskmaster or ruling planet of discipline.
Optimism is the close of any horoscope, or you will not pay the lady in the scarf.
To stay properly under the spell, we need a buy idea for a bear market.
On to the emerging bull market in insurance.
