


The continued march of the machines portends an earthquake in funds management.
The industry was already fighting the rise of low-cost passive investment vehicles, like index-driven investment delivered via Exchange Traded Fund (ETF) vehicles.
I wrote about this trend two years ago:
The benchmark for my global equities model portfolio is the Vanguard Total World Stock ETF VT. This tracks the FTSE Global All Cap Index, across 48 countries, 10113 individual stocks, and is 62% in the USA, for a bargain 0.06% MER fee.
I aim to beat this portfolio, in previous years we have, this year we have not.
The logical benchmark for US strategies is the S&P 500, which can be bought via ETFs. The one I use is the iShares Core S&P 500 ETF IVV at a 0.03% MER fee.
For flicking between a US and a non-US exposure, a good choice is the MSCI All Country World Index (ACWI). The so-called IMI Index is free float weighted. This means that only readily tradeable shares are included in the weighting.
You can buy the iShares Core MSCI Total International Stock ETF IXUS at a 0.07% MER.
For interest, let us just compare the YTD USD total return to 30-Sep-26:
VT: Vanguard Total World Stock ETF 12.86%
IVV: iShares Core S&P 500 ETF 12.72%
IXUS: iShares Core MSCI Total International Stock ETF 13.67%
The higher performance of the IXUS over the Vanguard VT relates to the greater breadth of the Vanguard product. It goes deeper into Emerging Markets.
These are all figures in USD for the US Exchange Traded product.
After thirty years trading in global markets, I prefer to access the cheaper, or free, brokerage, deeper liquidity, and lower fees of the US market, alongside direct equity exposures in Europe, Japan and Hong Kong.
If I looked at the Australian market from the perspective of a US domiciled investor, I would likely view the iShares MSCI Australia ETF product EWA, as the easiest marker. The MER on that is 0.50%, which is much more expensive than the above ETFs.
If you look at the sector breakdown, Australia is mostly a financials and materials market with the other sectors very distant in the capitalization rankings.
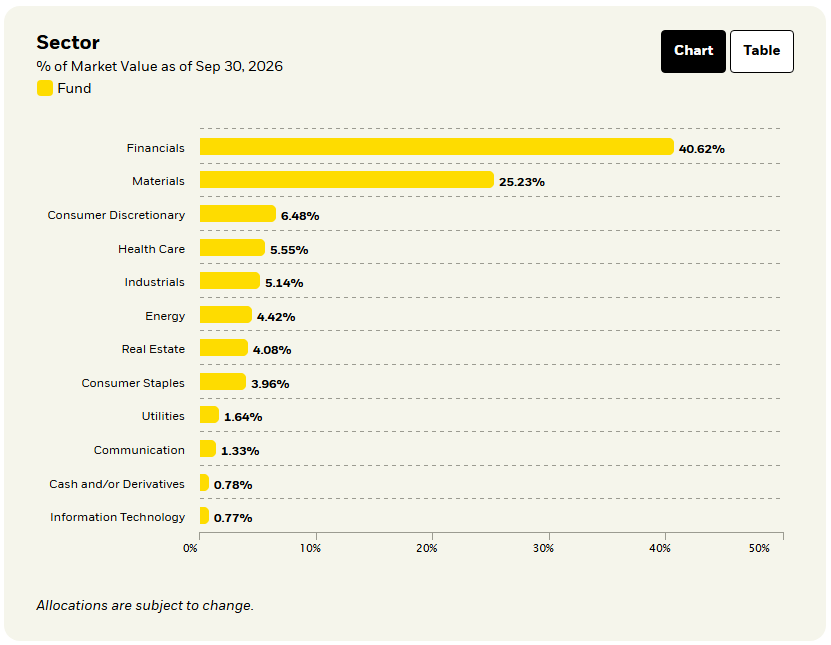
The top five single stock holdings of EWA are:
BHP 15.42%
CBA 12.61%
NAB 6.09%
WBC 5.99%
ANZ 5.77%
for a cumulative total of 45.88%. From a global perspective, that is one quality diversified mining company and four expensive low-growth banks.
Only Australian taxpayers qualify for the so-called franking credit, which is a deduction of company tax paid from the dividend payout.
Australians love this, so they bid up fully franked income stocks. Global investors do not see any benefit from this measure, so they generally find them unattractive.
For the global investor, the right comparator is the net dividend paid less withholding tax paid in the offshore jurisdiction, with any tax treaty benefit deductible in local tax returns. For Australian residents, this means that the 10% US withholding tax paid on dividends received in that domicile, provided you filled in the W8BEN IRS form, is deductible from your personal or SMSF tax return when filing in Australia.
The net of this is that grossed up yields on Australian listed stocks are generally comparable to the net yield on foreign stocks, provided there is a tax treaty.
Here is the approximate yield comparison on US ETFS, held by an Australian resident, after allowing for the tax-treaty deductibility of a 10% withholding tax. Effectively, you add that back, and so compare the gross yield on US non-Australian ETFS, to a local ASX listed counter, like the iShares Core S&P/ASX 200 ETF IOZ at 0.05% MER.
VT: Vanguard Total World Stock ETF Yield 2.85%
IVV: iShares Core S&P 500 ETF Yield 1.06%
IXUS: iShares Core MSCI Total International Stock ETF Yield 2.85%
IOZ: iShares Core S&P/ASX 200 ETF Net Yield 3.40% Grossed-Up Yield 4.86%
There is about a 2% yield pick-up on an estimated after-tax basis for buying local exposure to Australian stocks for an Australian domiciled investor.
This apparent allocational advantage fades once you consider strategies that are globally diversified and specifically target dividend yield. The iShares International Select Dividend ETF IDV has a 0.50% MER the same as MSCI Australia EWA ETF.
Note that yields are comparable in spite of base currency differences. While the IDV is in USD, and the IOZ is in AUD, the yield comparison is not greatly affected by any changes in currency. Nonetheless we can compare EWA directly to IDV.
Here is the sector breakdown of the IDV product:
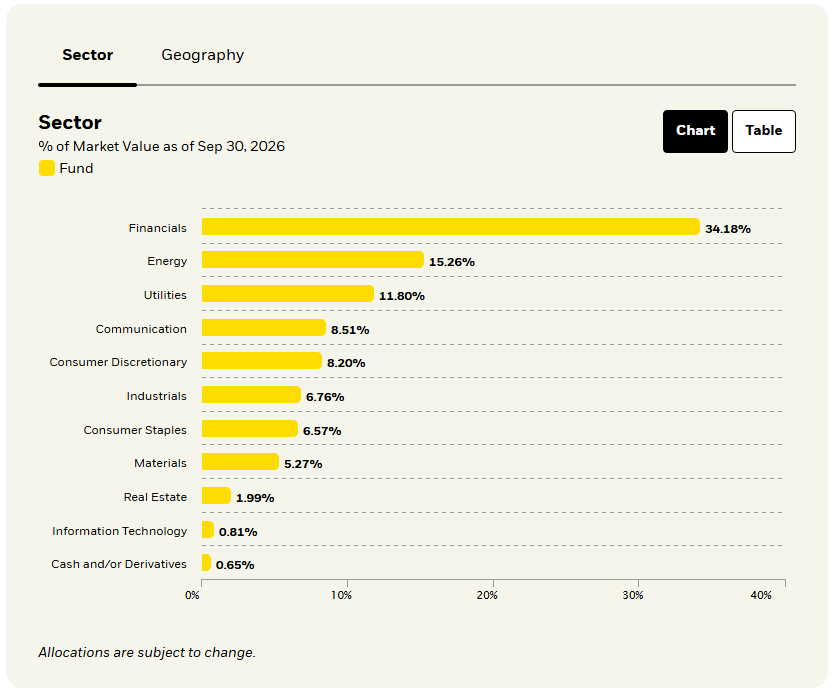
You can see that it is similar to Australia on Financials but has much better diversifying qualities with respect to other sectors. Traditional yield targets like Energy, Utilities, and Telecommunications feature prominently on the sector exposure ranking.
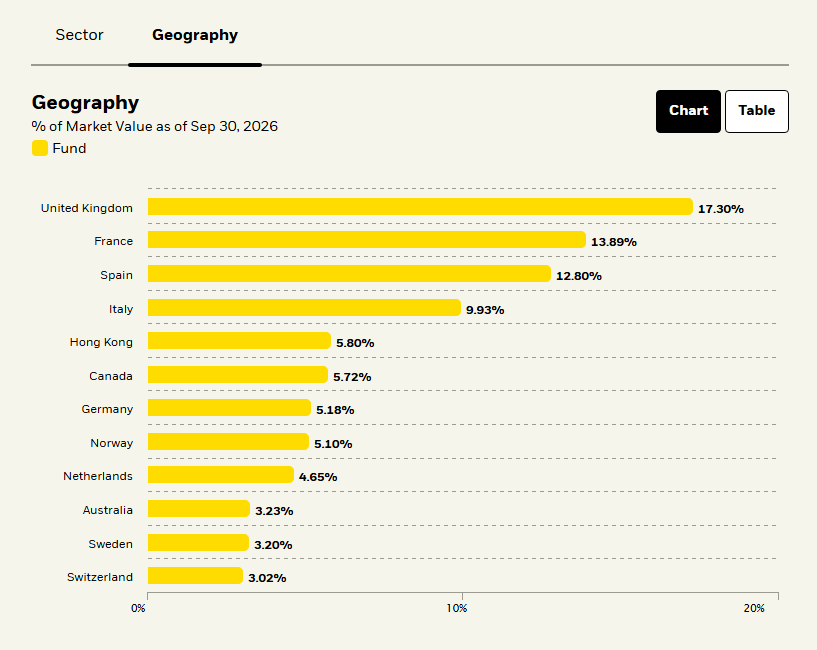
When we add all of that up, the USD comparison of EWA and IDV reads:
EWA iShares International Select Dividend ETF Yield 2.83%
IDV iShares International Select Dividend ETF Yield 5.03%
There are a few caveats with those comparisons that investors need to be aware of. Within a UK heavy exposure, the high-yield sector will include tobacco stocks.
IDV is no exception. The second-largest weighting is to British American Tobacco. You will typically find that in global dividend focused products. The solution, as always, is simply to check the holdings of the product for anything you do not like.
In any portfolio where you target single stock holdings you can always use the ETF listings on a site like iShares to look for ideas. Take the thematic you are targeting, which might be a financial objective, like income, or a growth exposure, like A.I., and list out the top ten global holdings. Review that to locate opportunity.
What about A.I. Screening?
The above is uncontroversial and practically directed exploration of likely securities you can put together, at very low cost, and little ongoing maintenance, to build out your global portfolio., In doing so, the research dimension and due diligence can be time consuming. Here is the first and most obvious place A.I. Systems can help.
Personally, I use LLM chat-based systems a lot, but I do so for lines of inquiry which I can vet and check for accuracy. I treat it as a time-saving tool to help me assemble information I need to make a decision, not the decision itself.
This may seem overly cautious to some, but is a lesson born of experience.
Some twenty years ago, at the dawn of electronic trading, I was leading Quantitative Trading Research for a large New York based firm that was rolling out automated trading systems to handle our $400B USD book of equity investments.
You learn a lot quickly when faced with such a large quantity of capital at risk.
On more than one occasion our team was saved by kill switches, filters, and triggers that were designed to stop the automated systems from doing stupid things.
The one I recall best is when some glitch in network code caused our system to place the same portfolio trading order for $200M USD gross of buys and sells into broker algorithms more than 40 times over. This meant $8B USD of trading!
Fortunately, on that occasion, automatic filters and kill switches blocked the trades from being executed, and we avoided a massive trading error cost.
Others were not so lucky.
On one infamous occasion, the High-Frequency Trading (HFT) firm Knight Capital Group went broke in under 45 minutes with a devastating software glitch. On the morning of 1 August 2012, the Knight Capital Group trading systems, which had a new software upgrade, erroneously flooded the market with orders due to a very subtle bug in the way the new system interacted with legacy systems. The robot became blind to the result of its actions, and kept repeating them!
The collapse of Knight Capital Group took only 45 minutes!
The death spiral was clear to all in the market inside 15 minutes and there was nothing management could do to stop the collapse. It went broke.
Since I have spent thirty years in markets, and before that some time in aerospace and defense R&D, I am always very cautious with the engineering of automated systems.
The old term is fail-safe.
When a system fails, due to unexpected data, and outage, or a software clash, there needs to be some higher-level function that automatically intervenes to offset the possibility of disaster by reverting to a different system of control.
In humans we call this quality consciousness.
It is what redirects our attention, in an instant, to take preventative actions.
One obvious example is the reflex action to grab a handrail if you trip on stairs.
However impressive current LLM systems may be in basic question and response cycles they are very clearly not conscious. It is easy to take any such system and wander into the realm of hallucinatory response and manufactured illusions.
This is just a fact of years of experimenting with such A.I. Systems.
I rate them positively for utility, but am very cautious in allowing them free reign to act without some outer control loop that can reliably detect destructive actions.
The story I often relate, from aerospace engineering history, is that of the fatal crash bv NASA test pilot Michael J. Adams, in an X-15 experimental spaceplane.

The fatal X-15 Flight 3-65-97, occurred on 15 November 1967, being the 191st flight of the experimental spaceplane. A number of factors conspired to cause the crash, which involved the spaceplane entering a Mach-5 spin on descent from 70,000m.
Adams was able to counteract the spin and recover at 36,000m altitude, but in an attitude that was inverted, with a subsequent Mach 4.7 dive. The control system was adaptive, with a high gain, meaning a sharp response to any deflection, that forced the system into an unstable condition known as a limit cycle oscillation.
The easiest way to explain that is to watch a video of pilot induced oscillation. The one below is from a 1970s test of fly-by-wire in an F-8 jet at NASA Dryden. If you stick with what looks to be a benign landing, to about the 20 second mark, you will get it.
The phenomenon of control system instability due to overcorrection, which then leads to amplification of initial trajectory errors, is known in engineering systems theory.
Nonlinear and adaptive systems are particularly prone to this problem.
Michael J. Adams did a splendid job of recovering from a Mach 5 spin (imagine that if you can) but could not cope with + and - 15G forces induced by the controller when it went into that limit cycle oscillation. He would have been unconscious at death.
The key point for readers to understand, is that LLM Artificial Intelligence models are nonlinear adaptive systems. Unlike the ones in engineering, there does not appear to be any serious effort by the creators of these systems to analyze the relationship between input and output to assess controllability, and a fail-safe mechanism.
Contemporary AI engineers appear to assume that because their systems are called “intelligent” they will engage in intelligent behavior under all circumstances.
Since I am a mathematician and can readily comprehend the structure of a deep neural network as a stacked system of iterated nonlinear maps, I have precisely zero confidence that any such system built today is stable.
There are no mathematical guarantees of stable system action.
Absolutely none whatsoever!
In the wild, under conditions to be discovered by the fates, I would happily wager that every single one of the current fielded systems is intrinsically unstable.
There is no evidence that I can see, from any of the published literature by the current leaders of Artificial Intelligence research, that mathematical stability is considered.
While the systems are in the class of iterated function systems, which are famous for their ability to produce chaotic relationships between input and output, the industry is flying blind on the consequences of fielding such active adaptive controllers into the very highest risk scenarios: military; medical; and financial.
While I do not wish to be a party pooper the outcome is 100% predictable.
These A.I. systems will fail in spectacular ways until the industry grows up.
You can positively bet on that being the outcome.
How to use A.I. Systems safely?
The basic issue is commonsense.
Only deploy an A.I. system with a strict outer control loop.
The correct fail-safe is a limited loss restriction.
In a financial context, this involves using that system only when it is possible to put a guardrail around it to detect and mitigate errors. The clear one for a question-and-answer style chatbot is to pose questions whose answers can be checked.
For instance, earlier we noted that there are a number of global dividend ETF products that could provide attractive yield compared to the Australian market. One downside which may appear is inadvertent exposure to tobacco stocks, in the UK, USA, or the Japanese market. This is not something you worry about in Australia.
Potentially, this is a very tedious exercise, but LLM chatbots can help.
The question is pretty clear, the target ETF products are known, and the answer can always be manually checked, which is the outer control loop on the bot.
I did this with Microsoft CoPilot (it is free):
Q: Can you review the ETF listings opposite, which are iShares ETF products targeting income and list out some suggestions that have low or no tobacco stock holdings?
this with the iShares dividend ETF listing open.
It answered with:
If your goal is income ETFs with low or zero tobacco exposure, the strongest candidates from the list are:
Likely zero tobacco
DIVB – iShares Core Dividend ETF
DGRO – iShares Core Dividend Growth ETF
IGRO – iShares International Dividend Growth ETF
Likely minimal tobacco
HDV – iShares Core High Dividend ETF
BIDD – iShares International Dividend Active ETF
Likely meaningful tobacco exposure (avoid for your screen)
DVY, IDV, DVYA, DVYE
This is easy (albeit tedious) to check.
DIVB has MO Altria Group
DGRO has PM Philip Morris International
IGRO has BATS British American Tobacco
HDV has PM Philip Morris International
BIDD has BATS British American Tobacco
DVY has MO Altria Group
IDV has IGRO has BATS British American Tobacco
DVYA has JT Japan Tobacco (JT)
DVYE has KT&G Corp (Korea Tobacco & Ginseng)
Actually, you can use the AI to confirm all of that if you have the iShares tab open on the holdings so it can go scan the list. When I say “confirm” you need to understand that one response is actually incorrect. DVYA has no tobacco stocks!
Q: I think you are wrong about DVYA. When I checked it had no Japan Tobacco.
You’re right to push on that—good catch.
Based on current DVYA holdings, there is no Japan Tobacco and, in fact, no explicit tobacco stock at all.
From the latest holdings data (61 positions, top weights like BHP, DBS, OCBC, Honda, Fortescue, ANZ, Santos, Westpac, UOB, Power Assets), the consumer defensive slice is made up of names like Wilmar International and Budweiser Brewing, not tobacco.
So:
- **DVYA today:**
- **No Japan Tobacco**
- **No direct tobacco holdings in the published list**
- Consumer defensive exposure is food/beverage, not cigarettes
My earlier answer leaned on index-structure priors (Asia/Pac high-yield → almost certainly JT) rather than the live holdings, and that’s where it went wrong.
You were correct to override it with what you saw on the page.
This happens all the time with A.I. when I use it for financial research.
The tools are helpful, so long as you know what you are doing.
This is not a problem solved by the non-solution “use Claude”. Every system will substitute informed guesswork in a seamless fashion with factual data.
Of course, you can use advanced system prompts that instruct the system to rely on factual results, with references, in preference to guesses, or to not respond.
Theoretically, that sounds like a workable solution.
In practice it will not be, because so much internet content is now machine generated. How is the machine to know what is good or bad data? How are we to tell?
The need for sense checking results has gone up, but the potential for organizing data to help make decisions has also gone up. The challenge is to balance risk with reward.
In my case, in the course of writing this note, I learned something useful for my own global portfolio. Among the usual suspects, one dividend ETF stood out:
DVYA: iShares Asia/Pacific Dividend ETF
It is the only one that does not currently hold any tobacco exposure (I used to be a chain smoker thirty years ago and know how hard it is to give up).
The 12M trailing yield is 4.53%, and the MER is manageable at 0.49%
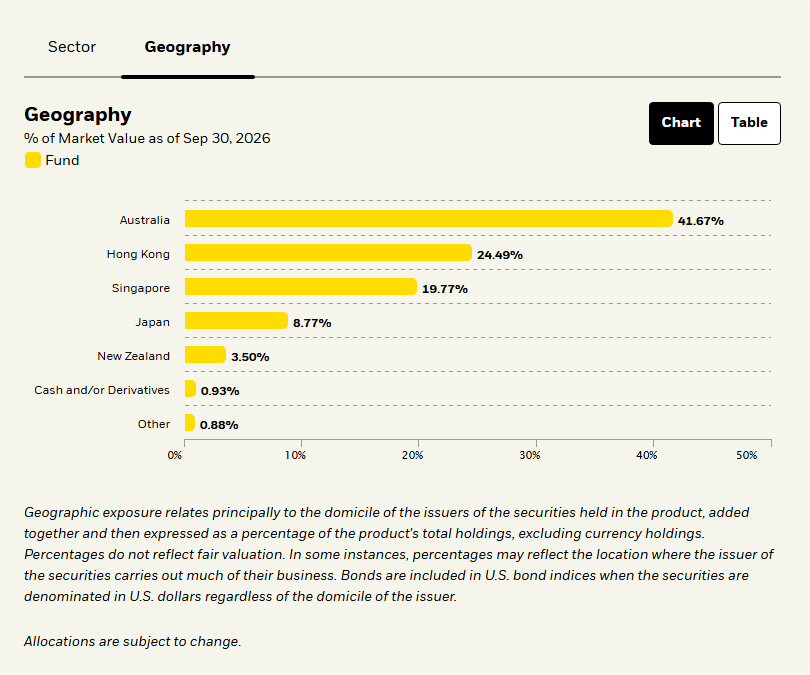
When I look at the sector exposures it feels natural to an Australian:
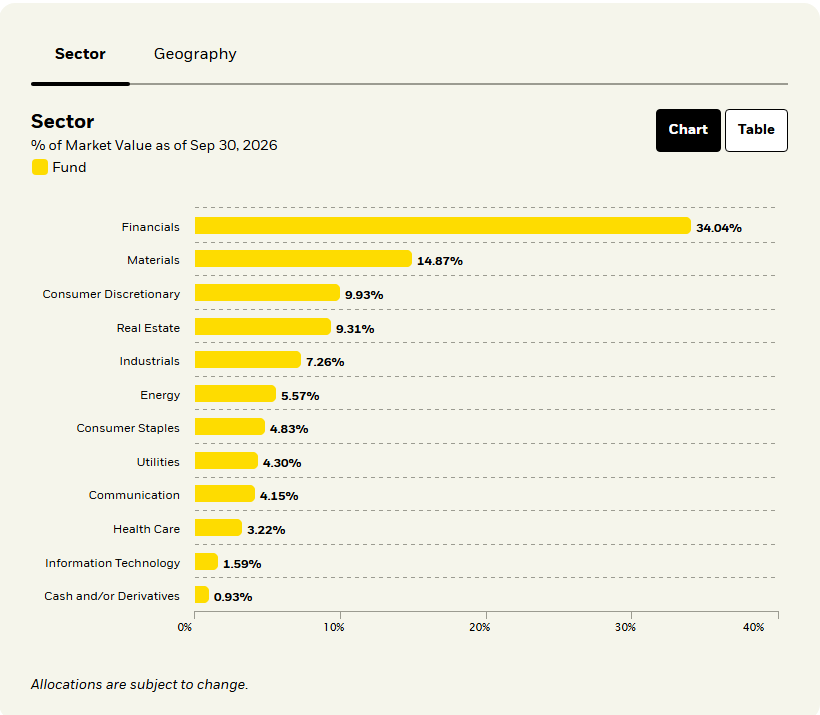
When I look at the geography I can see why:
Would I buy it in my Self-Managed Super Fund (SMSF)?
Certainly not, for an obvious reason.
I am an Australian tax resident and so benefit from franking credits.
It makes no sense for me to buy BHP in this fund over holding it directly, through an Australian listed security, for which I get the benefit of franking.
If I were in the USA, and looking for a non-tobacco dividend ETF, this is a good diversifier towards Asian markets with a dividend bias.
Looking at the holdings, I own the stocks in green already.
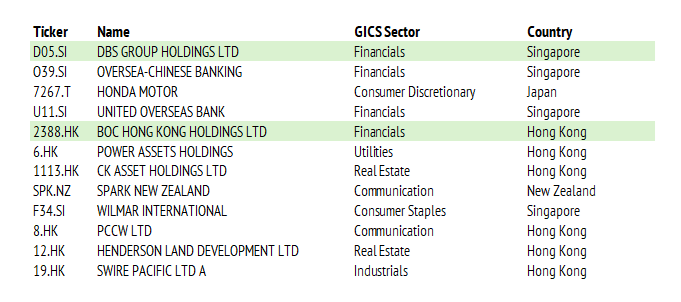
For diversification, perhaps I will look at the others which are not Financials.
This is an example of how research can benefit from the use of A.I. in a sensible and vetted fashion. These days you can trade pretty much anything in a global broker account, but you need to narrow the range of options.
Filtering by dominant ETF membership, seeking your chosen attributes, and working to exclude unwanted elements is a productive and reliable short-cut.
You do not want the perfect to be the enemy of the good.
However, you also want to know what is in the tin.
I have no doubt AI systems can help here.
You just need to be watchful for how they fail and be on guard for the most predictable failure of all: these systems are engineered to please you.
Skepticism is required to correct for the obvious bias to pleasing fiction.
This should not be unexpected for the seasoned player in financial markets.
We are all part of a global circus to profitably separate fact from fiction.
Happy investing!