


The Savvy Yabby Report distributes our institutional grade model portfolios to paying subscribers on a monthly basis. The current list includes these strategies.
Australian 20 Stock Model Portfolio
USA 20 Stock Model Portfolio
International (non-USA) 20 Stock Model Portfolio
Global Best Ideas 25 Stock Model Portfolio
There are no changes for the USA model this month.
The updated performance and current portfolio are given below.
The main theme in this report will be to look at mean reversion over short periods of one month, and to relate this to the wild swings of relative performance this year.
To set the scene, have a gander at this alpha chart.
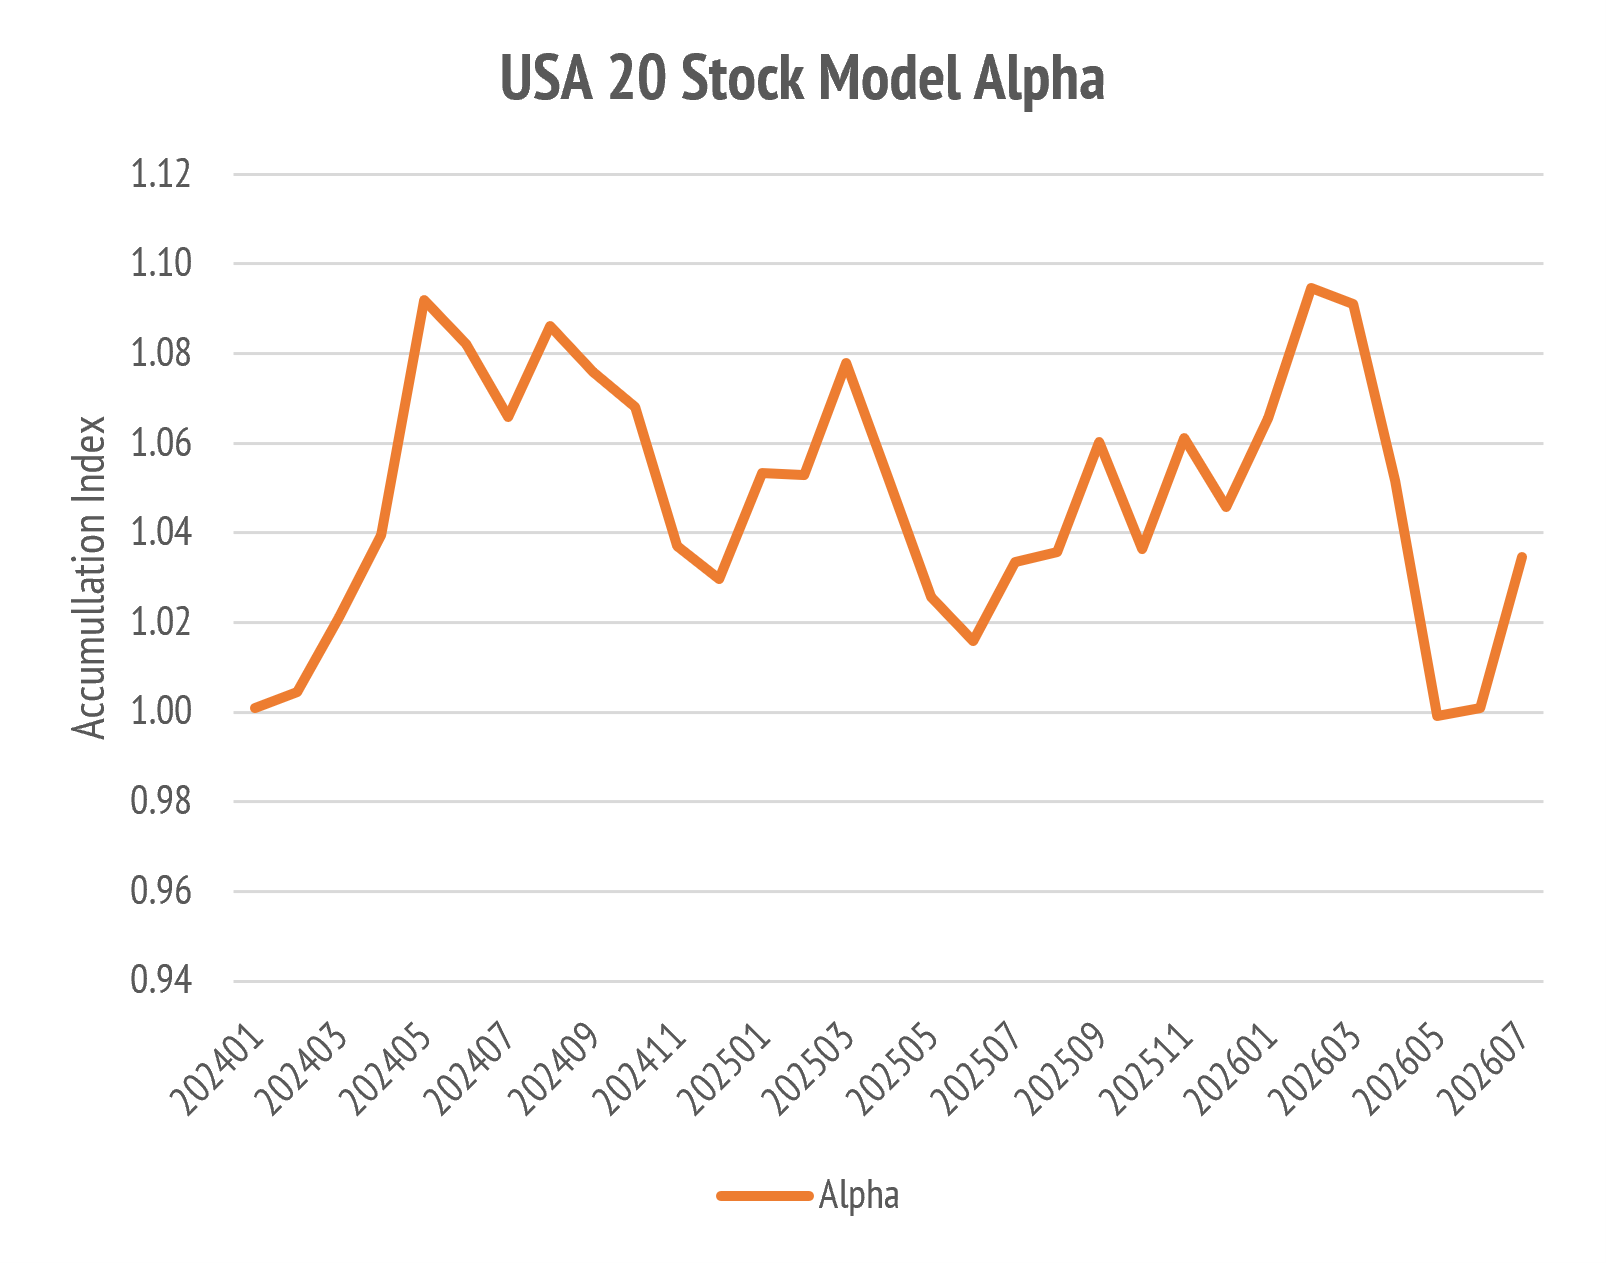
The issue driving this is two-fold:
Mean reversion on a one-month basis is very high right now.
The extreme concentration of the benchmark produces a large tracking error.
In the section below the line, we make a turnover analysis of the strategy, since the inception on 18-Jan-2024, just to check we are not trading excessively.
The summary is that we are not, but you can see from the monthly returns below that the strategy has a tracking error (relative risk) of 7.98%.
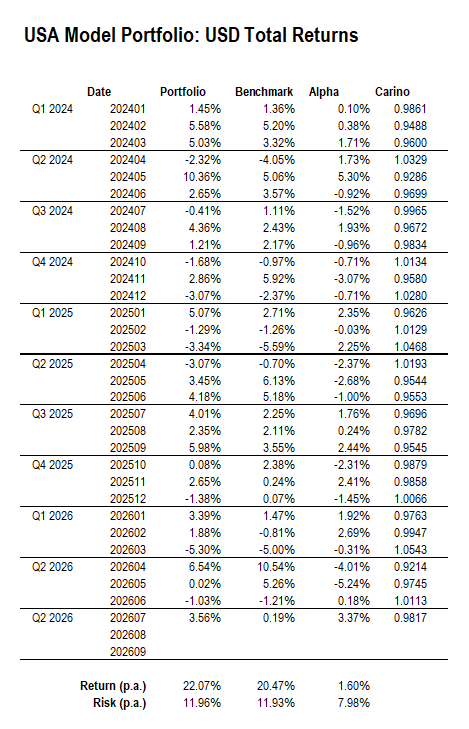
The annualized risk of the portfolio is 11.96%, which is pretty close to the S&P 500, at 11.93%, but the relative returns are varying widely, due to concentration risk.
In the USA, the top ten stocks in the S&P 500 are now 40% of the benchmark. We own four out of ten, so the swings in the other six have a big effect month to month.
Just to test whether we are going mad, I compared the total returns in June of the twenty stocks we own (Prior Month) to the same stocks in July (This Month).
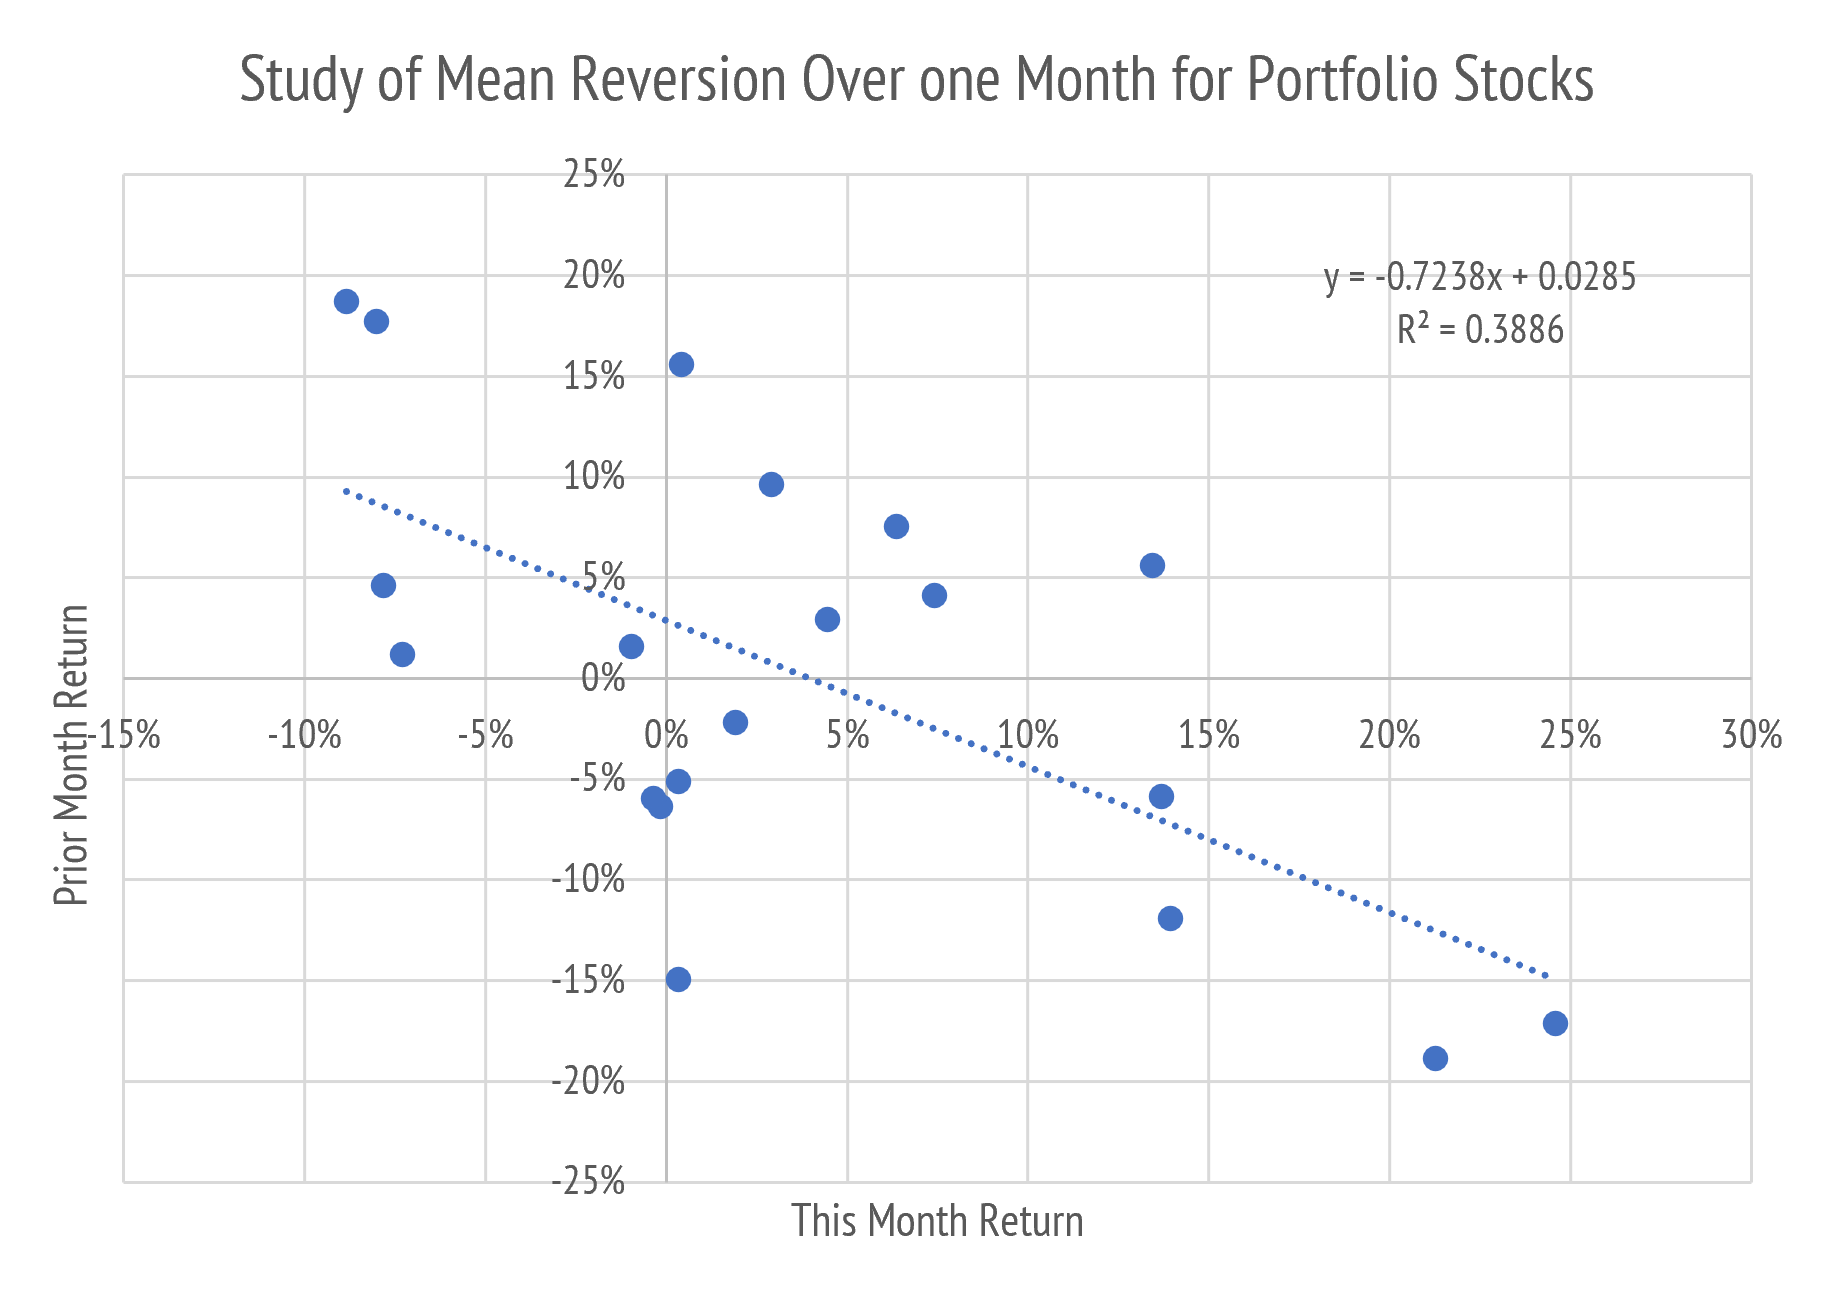
This is a scatter plot, where each point is one of our portfolio stocks. The line slopes down and to the right, because those stocks that did well in June did poorly in July and vice-versa. The slope of this line is -.72, a perfectly negative correlation is -1, and the so-called R-squared statistic is 0.389, meaning 38.9% of variation is captured by this simple linear regression. We did adjust weights on 7-Jul-26, but we owned the same stocks throughout. We just upweighted prior underperformers.
You can see that this effect is very powerful at this time.
Investors seem to be madly chasing performance, selling what recently did poorly to buy what is currently doing well, and that is proving to be counterproductive.
As I said, we are making no changes to the model this month.
However, mindful of this current reversion regime we have upgraded our toolset to give a better read on our own trading history and turnover.
In addition to the usual portfolio snapshot, as at 7-Aug-26, I include all of the trades and turnover since inception. We will use to help guide our rebalancing.
This year we traded significantly to position for possible stagflation, and the ongoing data center and AI boom. Since the top ten stocks are 40% of the benchmark, it can be very difficult to outperform at our target 30% turnover.
On the basis of our recent study, a turnover budget of 30% to 60% seems more like what is needed to navigate this concentrated and volatile market
