

Australian Twenty Stock Portfolio: Jan-2026
We provide a performance report on the Australian Twenty Stock model portfolio.

The Savvy Yabby Report distributes our institutional grade model portfolios to paying subscribers on a monthly basis. The current list includes these strategies.
Australian 20 Stock Model Portfolio
USA 20 Stock Model Portfolio
International (non-USA) 20 Stock Model Portfolio
Global Best Ideas 25 Stock Model Portfolio
The existing research notes and newsletter offer remains, but you will see some tighter integration between what we write there and the model portfolios.
Regulatory Disclosures
This service is owned and operated by Jevons Global Pty Ltd.
The licensing and complaints procedure is outlined in our Financial Services Guide.
For legal reasons, I need to include this informational disclosure.

These portfolios follow the Jevons Global investment process.
The last change to the model portfolio was effective at close 8-Jan-2026.
The changes were described in the Australian Twenty Stock Portfolio as published on this substack on 7-Jan-2026. The performance published here is based on the total returns for the model portfolio, on a dynamic weight basis to capture movement.
Real portfolios will differ in terms of the costs of trade, which are not included and the timing of any stock switches. The trades are modeled at close, but that is not known ahead of time. Therefore, these records do not represent a real portfolio.
Nonetheless, they are a guide to the approximate performance of the model.
NB: Past performance is no guide to future results.
Model portfolios are not audited and are only approximate guides to real results.
Performance Summary for Jan-2026
Overall, it was a strong month for the benchmark S&P/ASX 200. Through the month the total return of the index (XJT), was 2.44%. The return for the model was 2.35%, which was 0.09% behind the benchmark, the first lagging month in six.
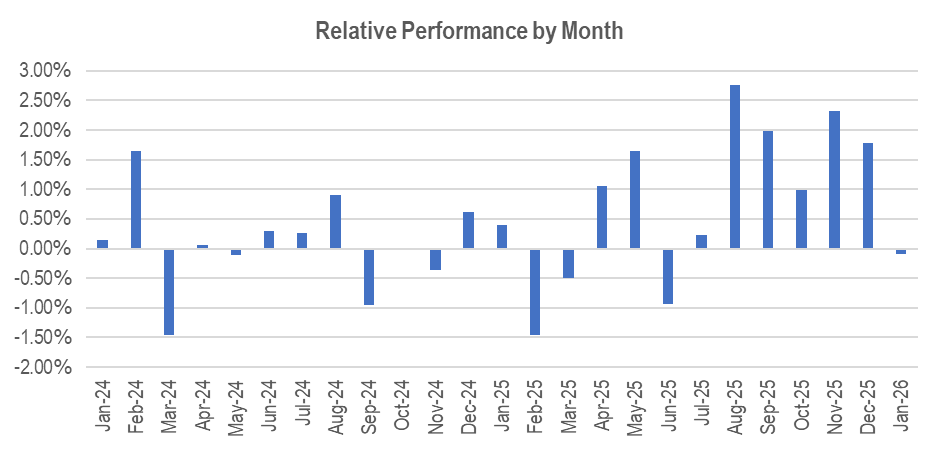
The positioning in precious metals and battery metals has helped lately.
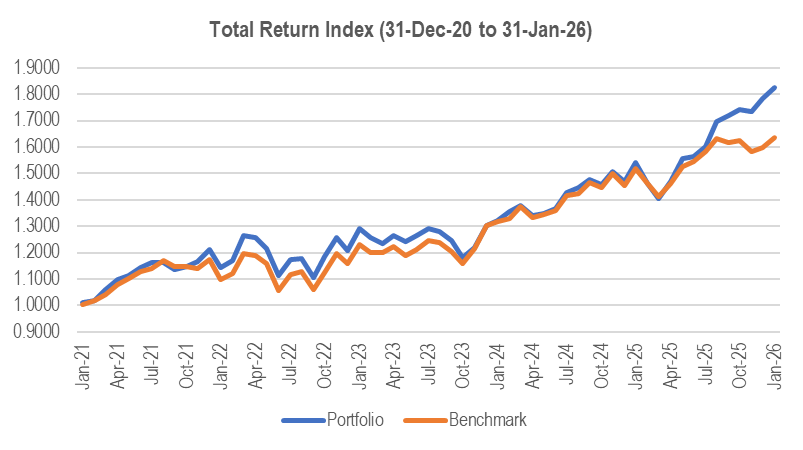
The recent period of performance has lifted averages over all periods since inception.
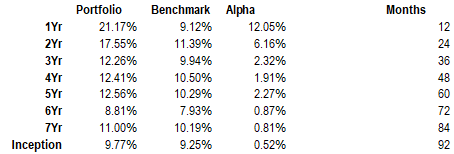
Note that portfolios will fluctuate and average performance was less positive over prior periods. Nonetheless, the relative performance is positive since inception.
The latest model weights are given below the paywall.
The summary data continues.
Key Contributors
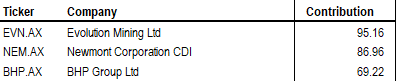
The top three positive contributors to performance in Jan-2026 were:
The top three negative contributors to performance in Jan-2026 were:
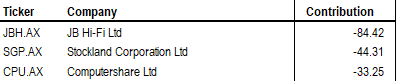
In a nutshell, it was a positive month for resources, notwithstanding a very late correction in gold, which is included in the above.
The drag came in real estate and technology. The model avoided most of the savage correction in Australian technology stocks as we had exited Technology One TNE.AX around the middle of last year, when we increased exposure to battery minerals.
However, we are carrying a significant overweight to interest rate sensitive stocks in real estate, and these had a poor month. We will monitor that going forward.
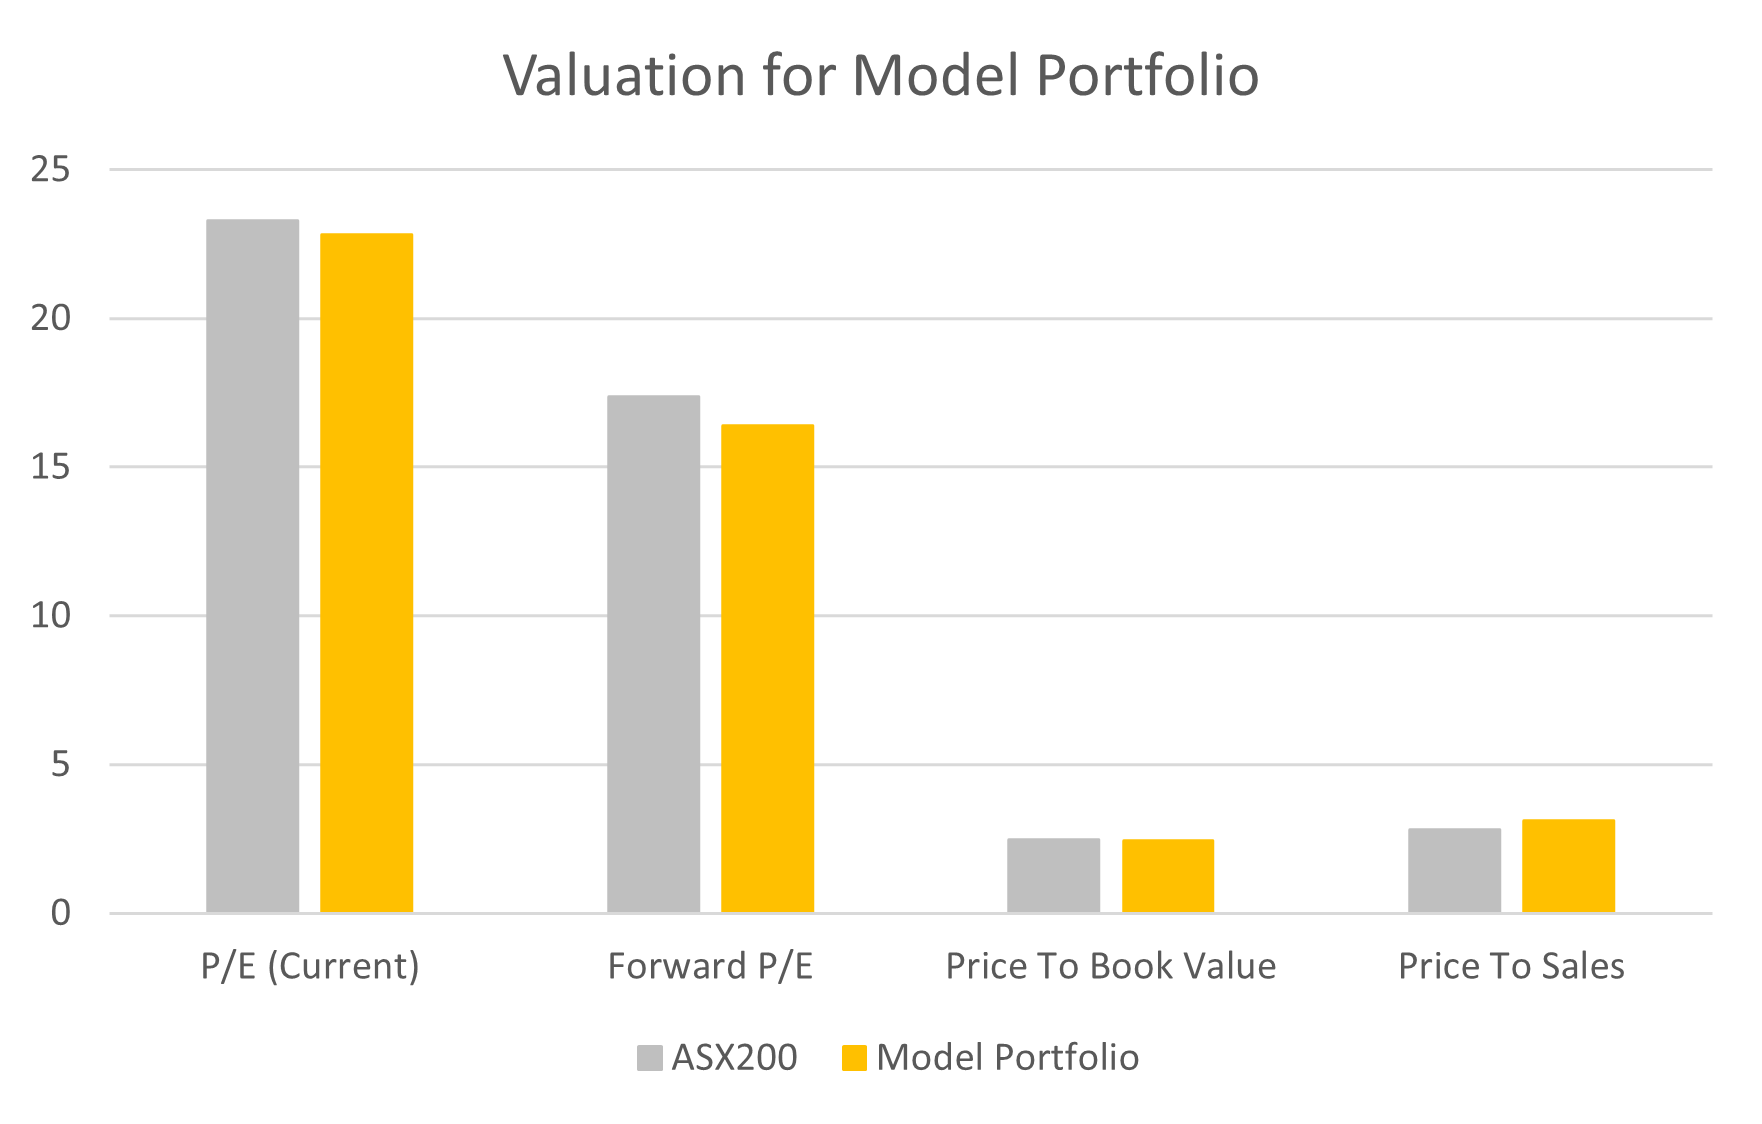
Portfolio Valuation Metrics
The portfolio is showing valuations generally in line with market.
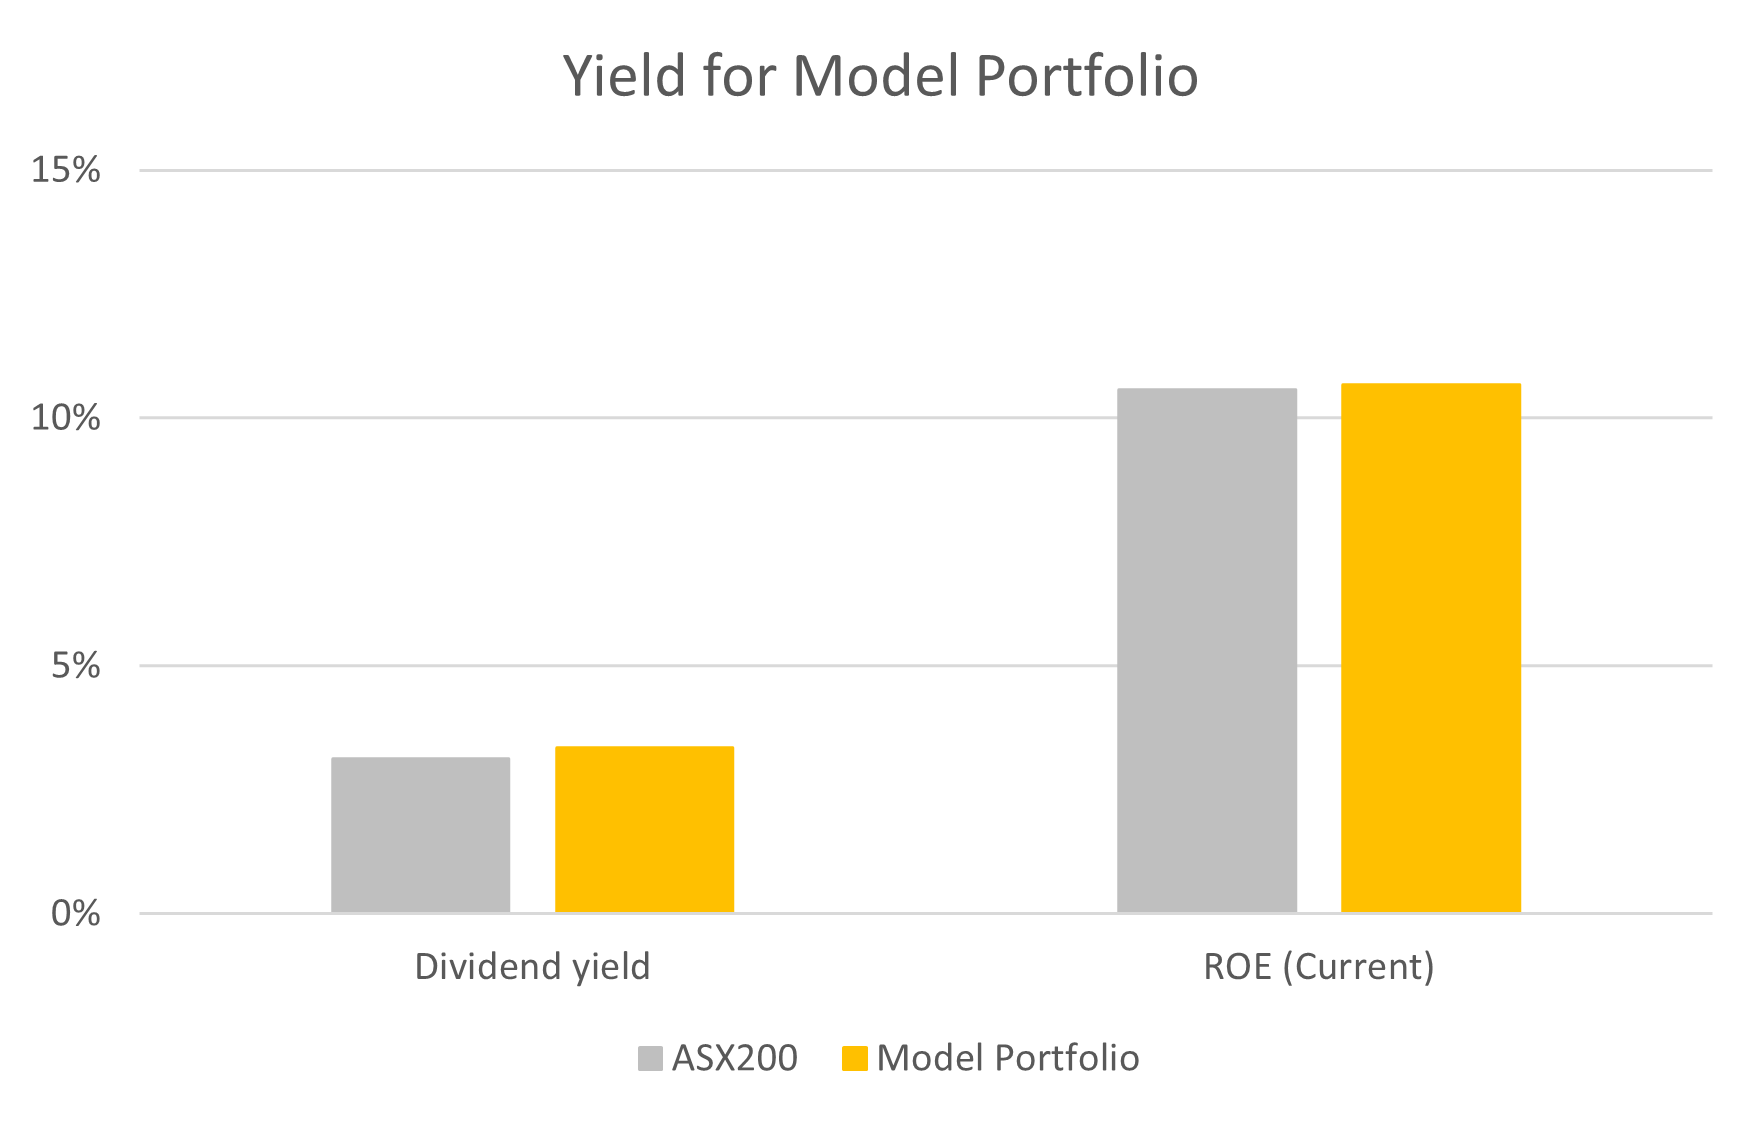
The dividend yield and Return on Equity (ROE) are also in line with market.
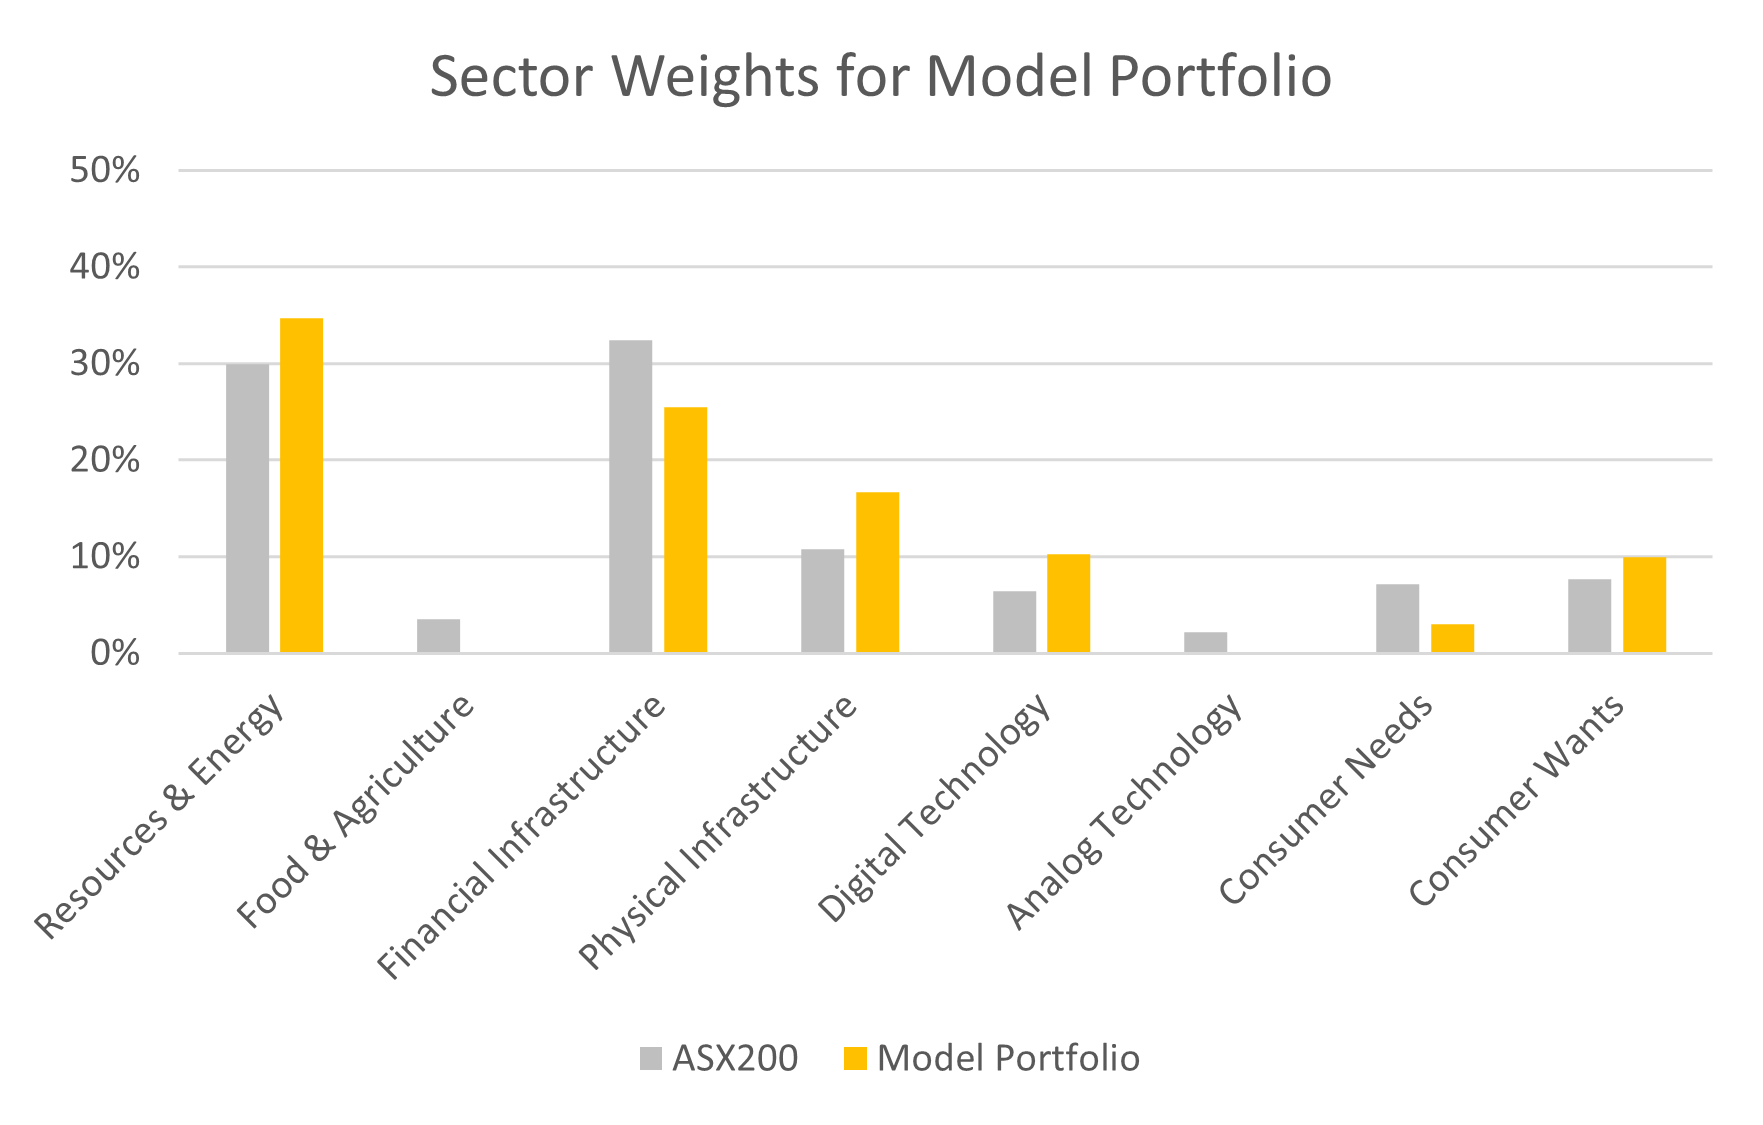
The sector positioning is overweight resources, physical infrastructure, consumer wants and digital technology.
It was a poor month for technology, and our stock selection helped minimize the damage caused by a savage correction in high PE-multiple stocks.
The gold stocks performed well through the month, although they corrected at the month end due to the sharp pull-back in precious metals futures markets.
The current weights for month-end are below.
