

Steidlmayer Market Profile for Silver Futures
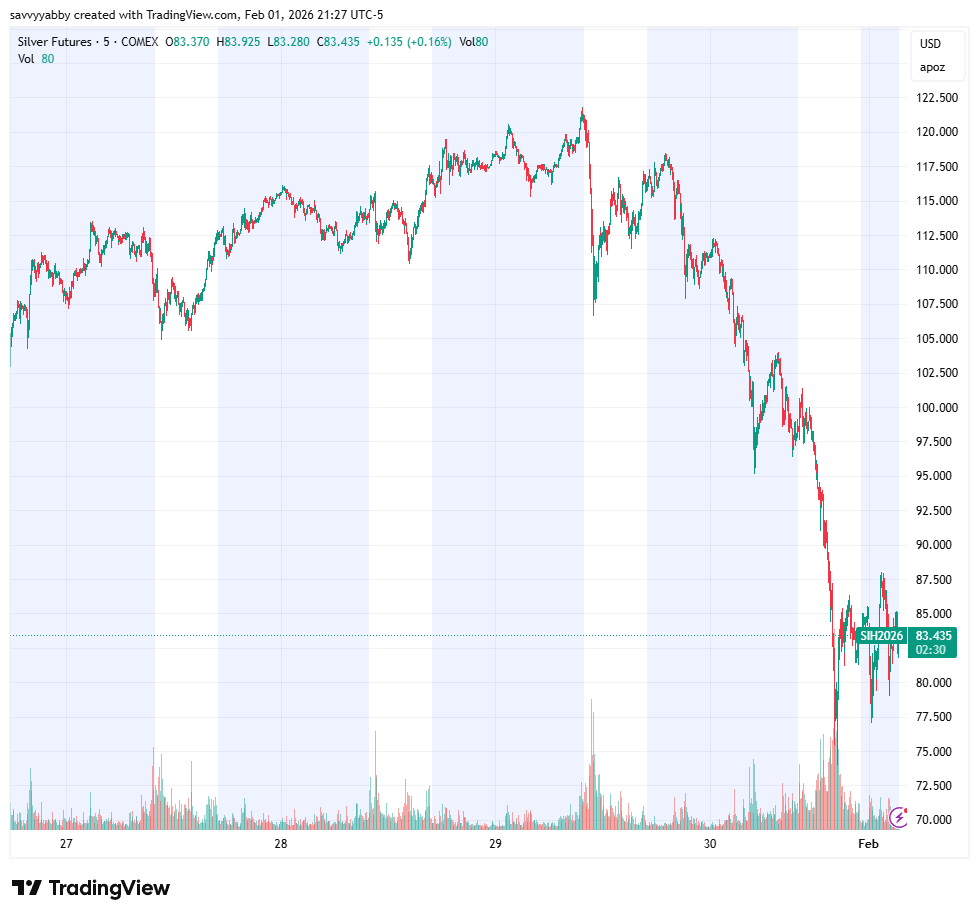
The violent price action in the silver futures market on Friday highlights the extent of leverage in this market run up. The Steidlmayer Market Profile is used to locate support and resistance levels.

These are officially fast markets for precious metals globally.
The 31% crash in COMEX Silver Futures SI1 on Friday 29-Jan-2026 says it all.
The session opened at 115.585, made an intraday high of 118.450 and then crashed to a low of 74.000 to close at 78.530 on large volume. For context, this wild move took us back to where Silver traded in the last session of 2025, on 31-Dec-2025.
That is some traffic.
What to do now?
BUY
Let us see why by looking to an old futures trading methodology to understand where the likely price turning levels will be in this market.
The key to understanding the moves, and the mood of this market, is the price levels of interest that matter to leveraged money, and how this relates to price action.
In previous notes, I have explained how the cost-basis indicator can be useful to help determine investor sentiment in equity markets. That is a turnover-weighted moving average of stock trading that estimates the average cost-of-entry for a stock.
This works for equities because of a relatively long average holding period.
Cost-basis methods do not work for futures markets due to the high turnover.
The average holding period for futures is minutes to three days.
The Steidlmayer Market Profile is the analogue of cost-basis for fast markets.
In this note, I will explain the differences and similarities between the two methods, and how you can use Steidlymayer market profile for a sufficiently fast market.
The Steidlmayer Market Profile
The analysis I will enter upon is based on a technique of volume-at-price analysis that was pioneered by Chicago Board of Trade futures trader J.P. Steidlmayer. The origin of his method and view of markets was described in several books.
The interpretation of such data that I will offer is not identical to that of Steidlmayer due to the different timescale of focus that I employ in trading operations.
For more detail on the original work of Steidlmayer consult his Profile Trading website.
The reason that I am giving a big shout out to this worthy method of analysis relates to my own focus on multi-session trading, over longer time periods, like months.
In this brief note, I will highlight how the readily available Volume at Price chart, which you can find on services like Bloomberg, TradingView, and TradingTechnologies.
The essence of a Volume Profile is to plot a histogram showing how much volume traded at different price levels during a fixed time window.
The interpretation of such data varies a little by proponent, but the basic idea is to understand where traders have previously shown interest in buying or selling.
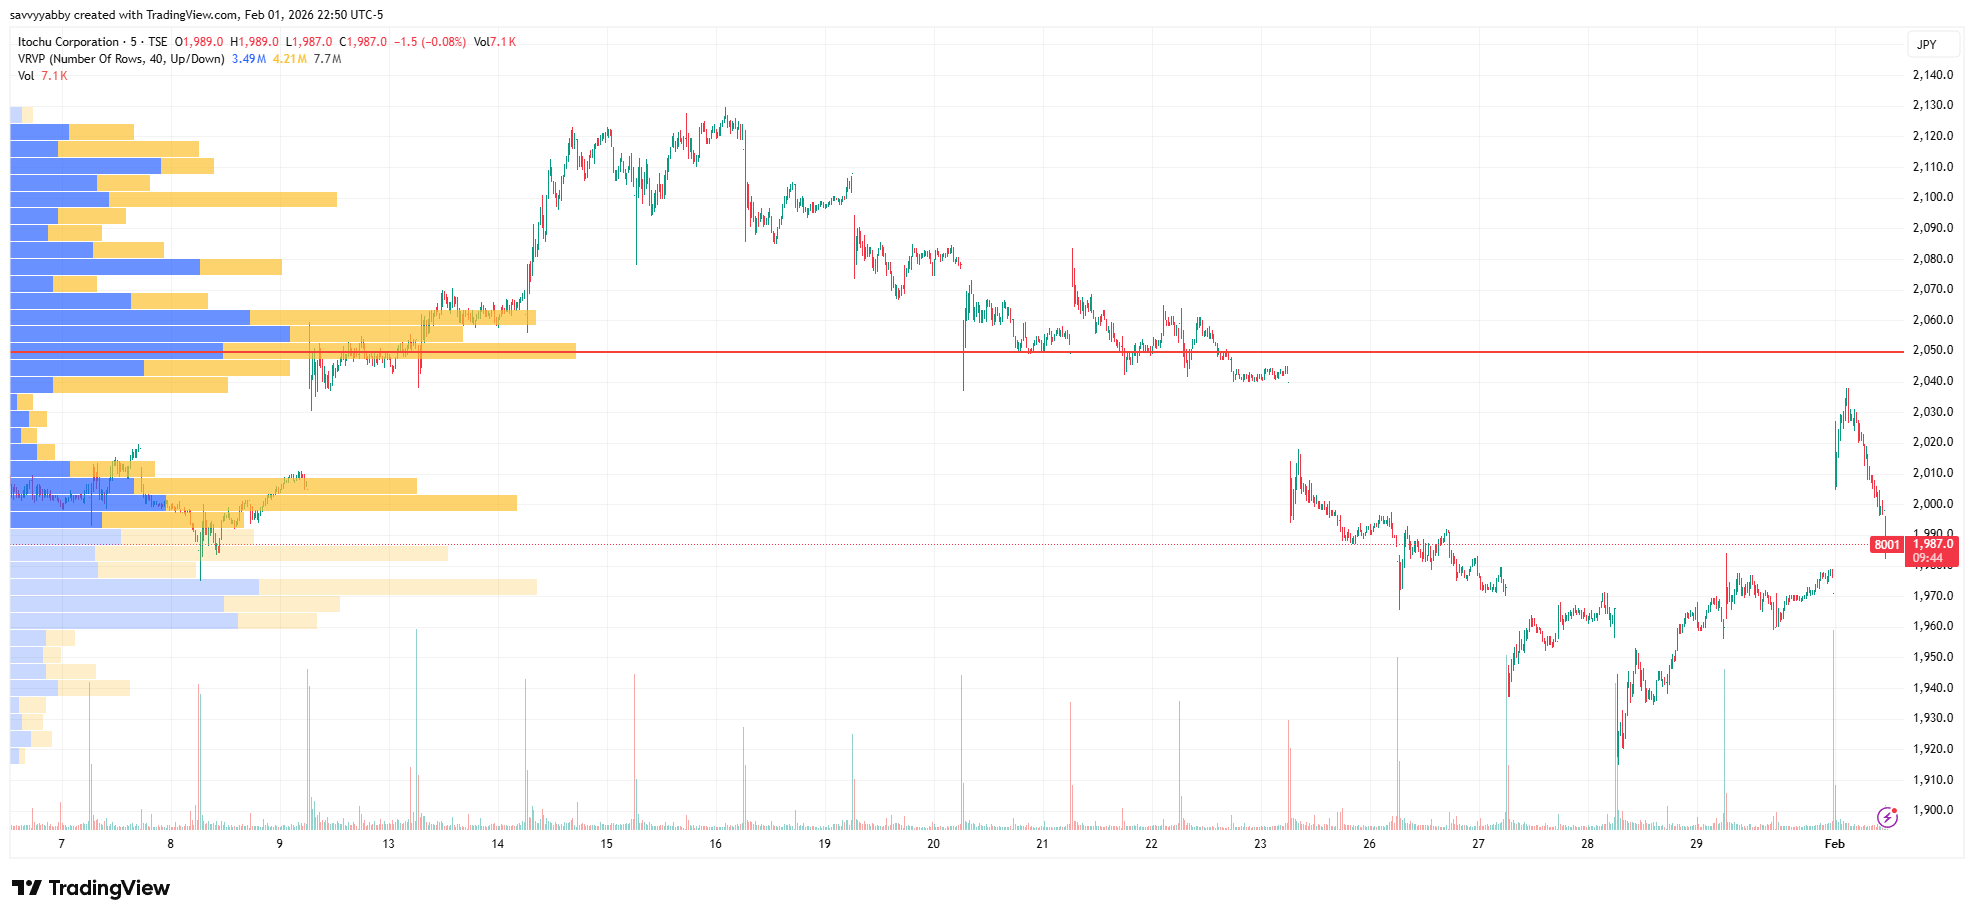
The Trading View chart below shows volume-at-price for COMEX Silver Futures SI, over the five-day period up to and including the Friday 19-Jan-2025 session.
Notice that the longest volume bars over that five-day window are along the higher price levels in the four days prior to the sell-off.
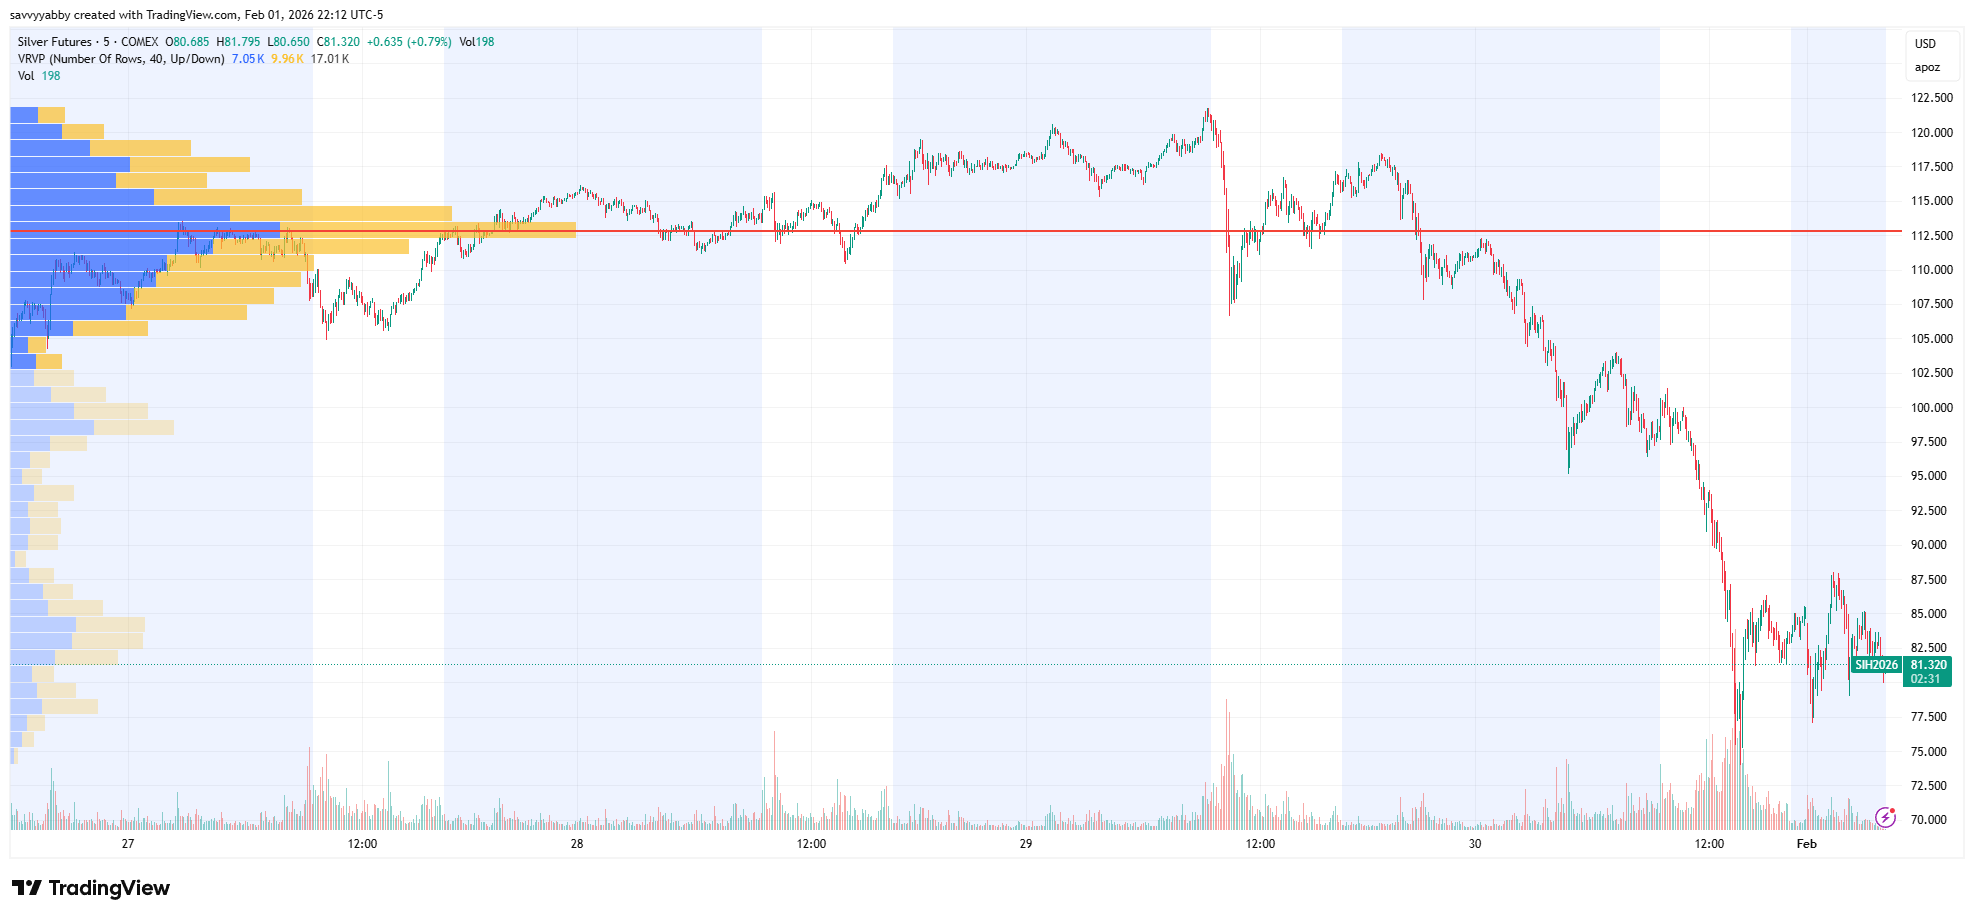
One refinement of the idea is to color code the volume, using a trade initiation rule such as the Lee and Ready algorithm. This is an approximate method to account for which side of the market initiated a trade, buy or sell, using a midpoint rule.
In the above chart, the blue is buyer-initiated volume and the yellow seller-initiated. There is not usually a large difference, but it does happen sometimes.
While such methods are imperfect, they can make sense of the idea of buy versus sell volume meaning which side of the market the most urgent order flow comes from.
In simple terms, every trade represents one buy and one sell, but the urgency of the trade will be reflected in how willing a market participant is to cross the spread.
Modern markets, including the great bulk of futures trading, are electronic order book markets which operate on a continuous auction basis. This means that buyers and sellers are entering their order sizes and order type on a continuous basis.
There are many order types, but the main ones for our discussion are market orders and limit orders. The first has a side, buy or sell, and a quantity. The price at which such an immediate order is filled depends on the other order type. Limit orders are price-sensitive, they have a fixed bid or offer price, and a quantity. They are also executed on a price and time priority basis. The lowest and earliest offers for sale, or the highest and earliest bids for purchase are filled first, in a queued fashion.
When we look at a Volume Profile Chart, we are compressing all trade over that fixed window into a record of trading interest. This can be confusing to interpret, until we recall a few principles that relate to the cost-of-entry for traders.
Relationship to Cost-Basis Profiles
I invented the cost-basis indicator for equity trading back in June-2002.
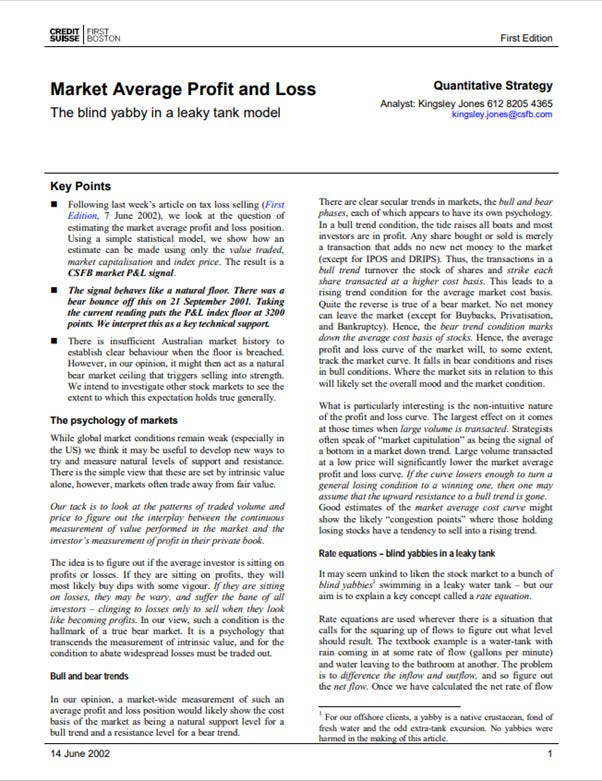
At the time, I had not heard of the Steidlmayer Market Profile in the futures market.
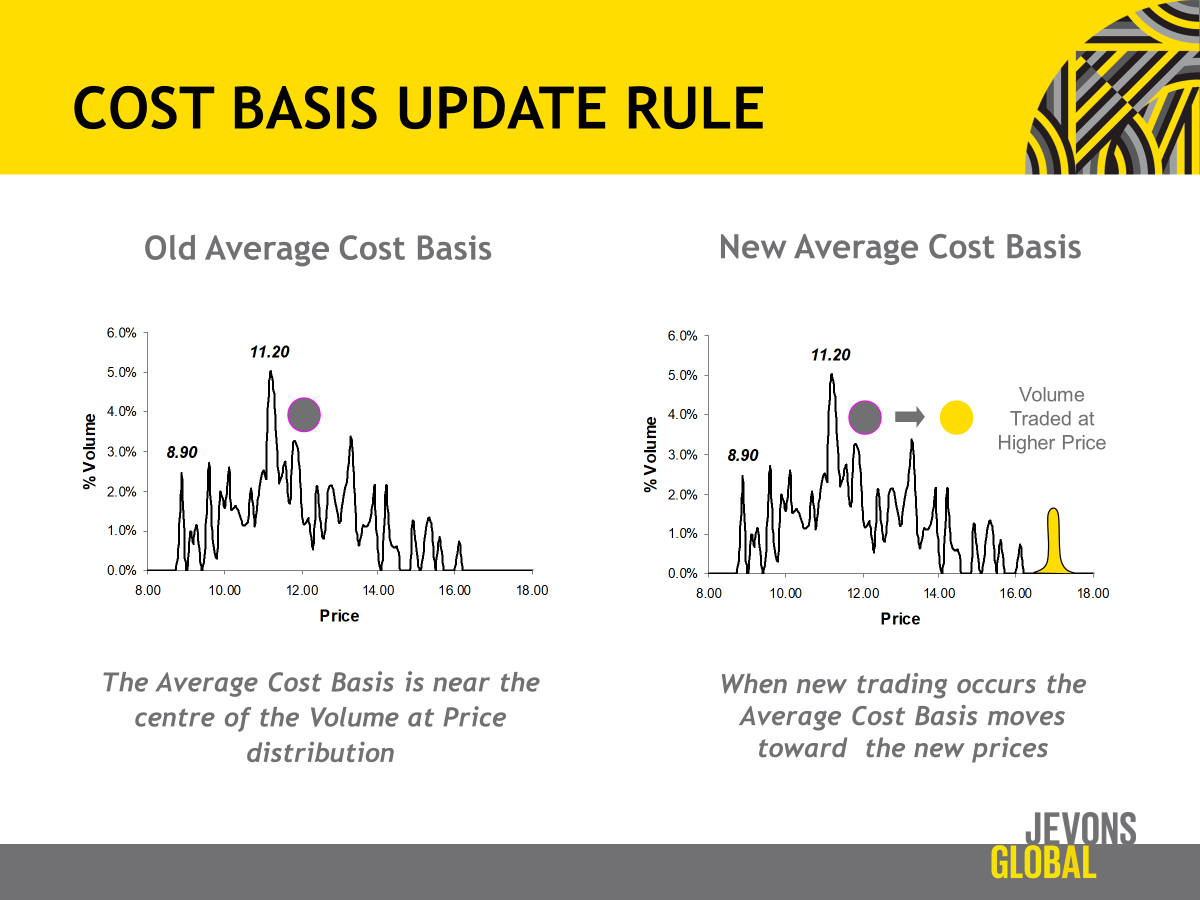
However, I used the same volume profile charts to explain how my cost-basis method of estimating the average cost of entry for stock trading worked. The slide below is taken from a presentation I gave to the US Market Technicians Association back around 2012, describing the cost-basis method.
There used to be a video, which is gone now. I may need to redo it :-)
The basic idea for cost-basis is that the current holdings of stock must have been buys at former prices, but the register turns over in proportion to market turnover.
Prices from long ago remain relevant, but market memory fades over time.
The rate at which the market memory fades is proportional to the rate of turnover.
The commonality of the two methods relates to the use of a market profile of volume that has been traded at different price levels through a window in time.
The difference between them is that the futures market version is really designed for the intraday trader, who must quickly assess where the levels of interest lie during a trading session. In my days as a quantitative trader, we did the same using tools such as the Bloomberg Volume at Price (VAP) to pick out where Dark Pools were active.
The bottom line is that futures markets have very short time memories.
This is why the original method of Steidlmayer does not use any measure of turnover. The volume at price is plotted as it comes, and the peaks do not fade over time.
This all makes perfect sense and can provide short-cuts to trading insight.
Combining Cost-Basis and Market Profile
The central lesson from this detour into the history of two apparently different ideas for analyzing markets is that the underlying principles are common. The detail of the methods is different because they are addressing different time horizons.
Futures markets are always fast compared to equity markets.
Rarely do I ever adjust the trade volume from a futures market to reflect any memory effect in that market. It can stand unadjusted for what it is, a record of interest.
Equity markets differ in that the register of shares changes slowly.
It is more apparent why there is long-term memory in the equity market because some shares are still held that were bought a very long time ago.
I still own this stock, Itochu 8001.T in Japan, which I bought back in mid-2011.
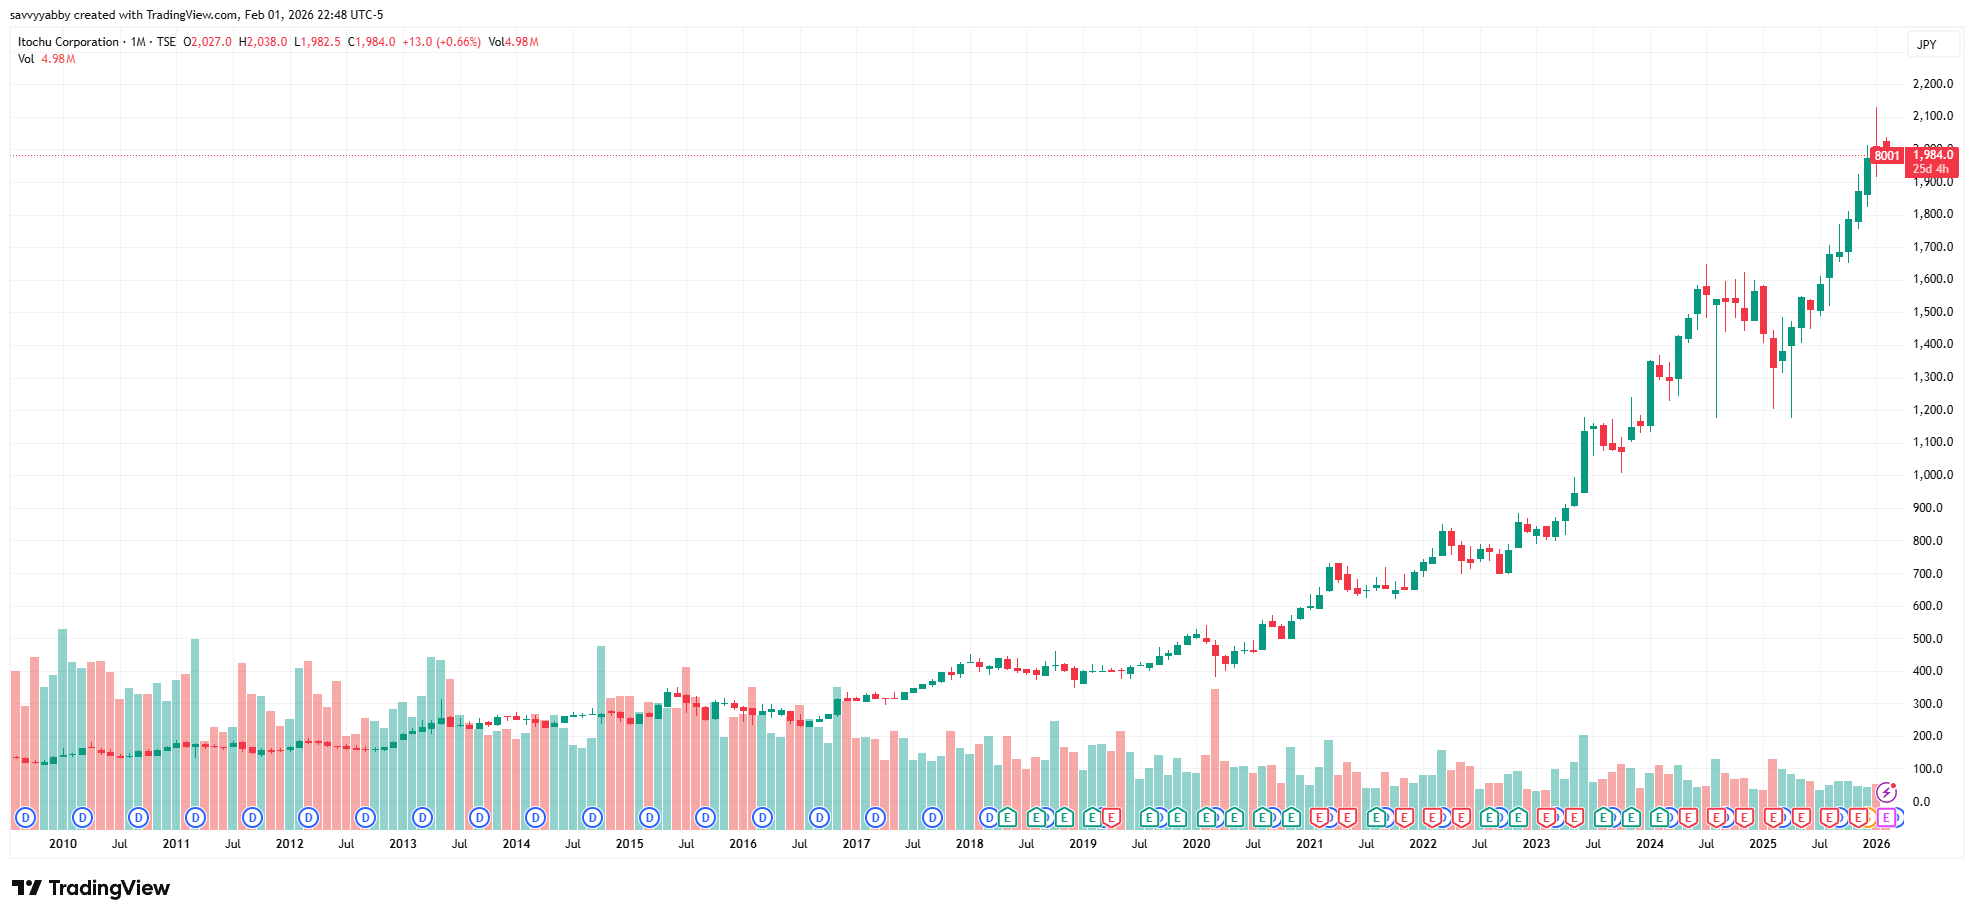
That is up more than tenfold and so there are holders who remember that price.
However, a day-trader in Itochu, or a desk trader supervising algorithmic trading in that stock will be looking at 1972 Yen as a key support level in today’s session.
The message to impart is that traders always use charts to determine interest to trade.
This is not some mystical hocus pocus.
It is a very practical and thoroughly grounded method to estimate current positioning for those in the market to sell stuff they own already, or to buy more.
You can choose your tool, as appropriate.
If I were designing quantitative trading systems, I would use volume-at-price, order flow and order imbalance, plus order-book slope to determine the market state.
These days I invest and trade over months and years.
Cost-basis is better suited to such long horizons.
The Silver Market Profile
You will read endless commentary on what happened, why and when.
That can be useful at times.
Superficially, this was an overbought market that ran into some fund subscription and redemption restrictions in China, meeting options expiry dates with a preponderance of in the money call options to be hedged, and some market chatter on the Fed.
Do the reasons matter?
For some market participants coming up with a reason matters a lot. For me it matters less because this is a fast bull market where deleveraging will happen quickly.
The thing that matters most to me is where exactly the market slide stopped.
Notice that I am making a trading decision in response to what happened.
It does not matter to me what triggered the sell-off since I know this was a levered run that just flushed out a lot of margin calls, option hedging and stop losses.
That will move the market down in a great hurry.
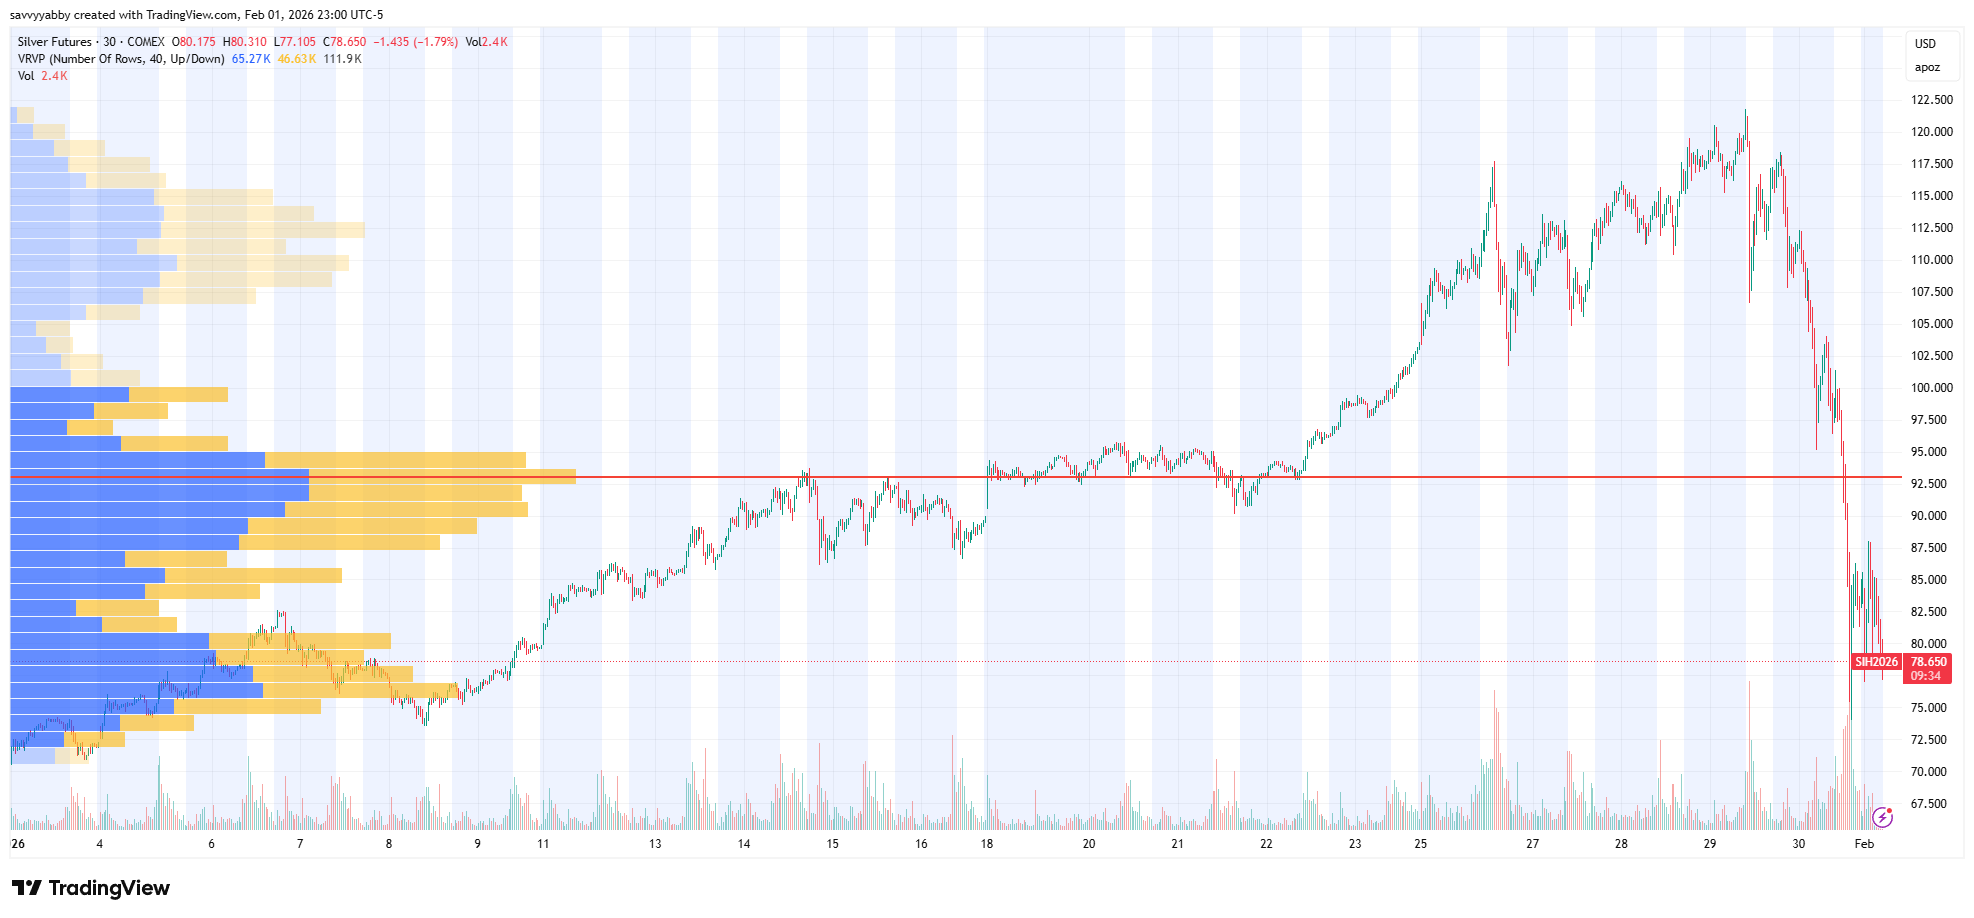
However, the above one-month chart for Silver Futures tells the story I am interested to interpret. Do you notice that the Market Profile has three broad humps.
The one in the middle is the largest, and that is overhead, as upside resistance.
The one where the market turned, around $75 is also quite large.
That is downside support.
We are currently trading around $77 USD as I write this, with resistance at $93 USD.
That is a fair risk-reward to capture $15 USD upside for $5 downside.
The market will toy with that, re-enter, and trade upwards.
The reason is that we reset the price ledger at the year close value for 2025.
The outlook for silver is still bullish in terms of central bank buying.
What moved the market fast was deleveraging in futures trading.
Some were handed their own heads from too much leverage.
Condition normal. The bull will return.
Conclusion
This short article provides some context for how I will treat this correction.
Expect more articles on a rapid cadence.
Opportunity abounds.
Take care, do not assume too much leverage, and happy trading!