

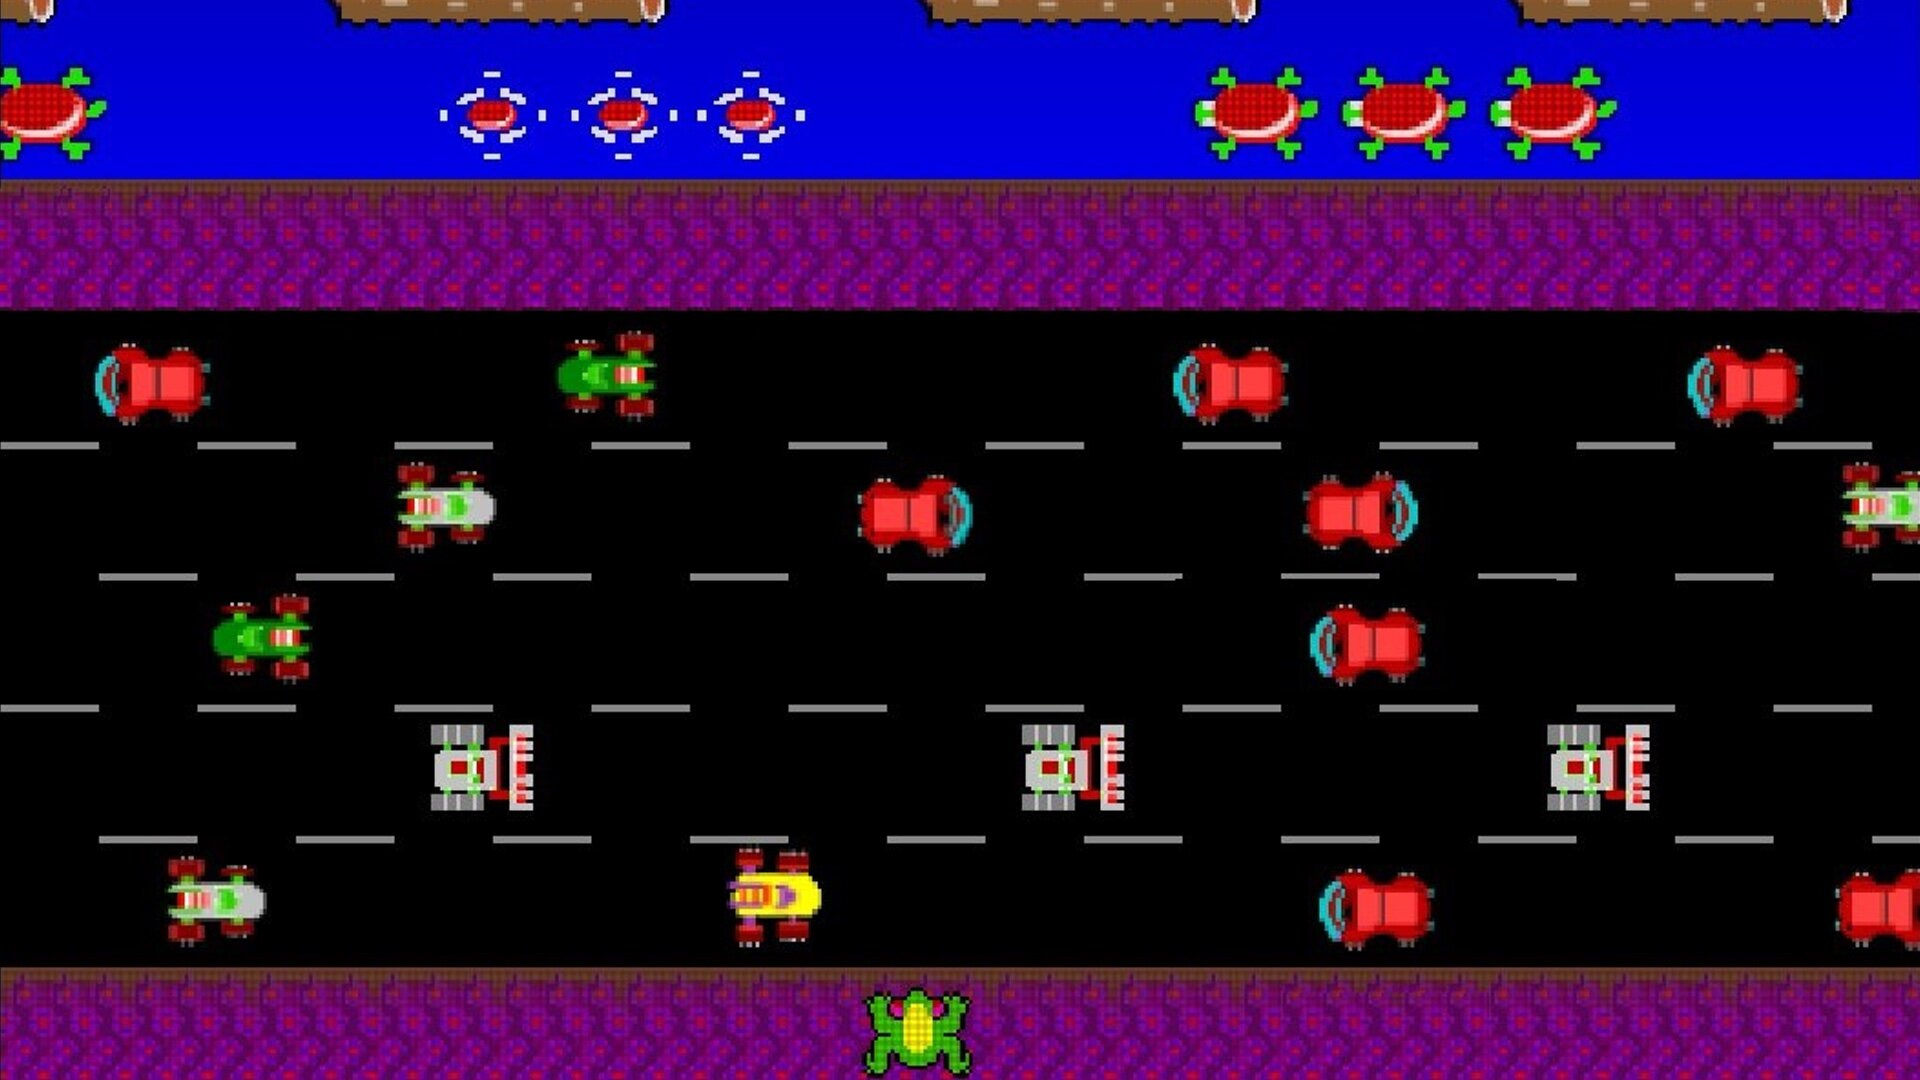
Gap in traffic
A major change in the primary trend of a stock market is difficult to navigate. Here we advise on moving by stages and choosing to move when you see a gap in traffic.

The last month has been a crazy period in markets.
It would be easy to feel like the hapless frog in Frogger, wondering when it might be safe to venture out into traffic. In this note, we argue that time has come.
The market score so far
Let’s review the market score from two angles.
The ideas we had and how they have turned out whether good or bad
The ideas we did not have with a focus on those where we were blindsided
I will not be exhaustive, but I will focus on what I think is signal as opposed to noise.
Due to the extreme importance of geopolitics at this time, I am not going to dwell on single stock discussion, like what happened to Mineral Resources XASX: MIN, except if the trajectory is relevant to the present outlook as I see it.
The best way to sum up my thinking over the past six months is a gradual shift to build confidence in the idea that geopolitics will reshape financial returns.
This began to take shape in late 2024, with the piece Gold and the BRICS.
Gold has been in a bull market for years, but it is only in the last year that it really started beating stocks while those were also rising.
Gold ARCX: GLD is up 10.5% in US dollars since our piece on 26-Oct-25, although US were winning through to around 20-Feb-25. The S&P 500 ARCX: SPY is down 2.62% and the NASDAQ cubes XNAS: QQQ is down 2.92% over the same period.

The real damage was done since early February 2025, once President Donald Trump was installed and it became clear that tariffs, in general, were for real.
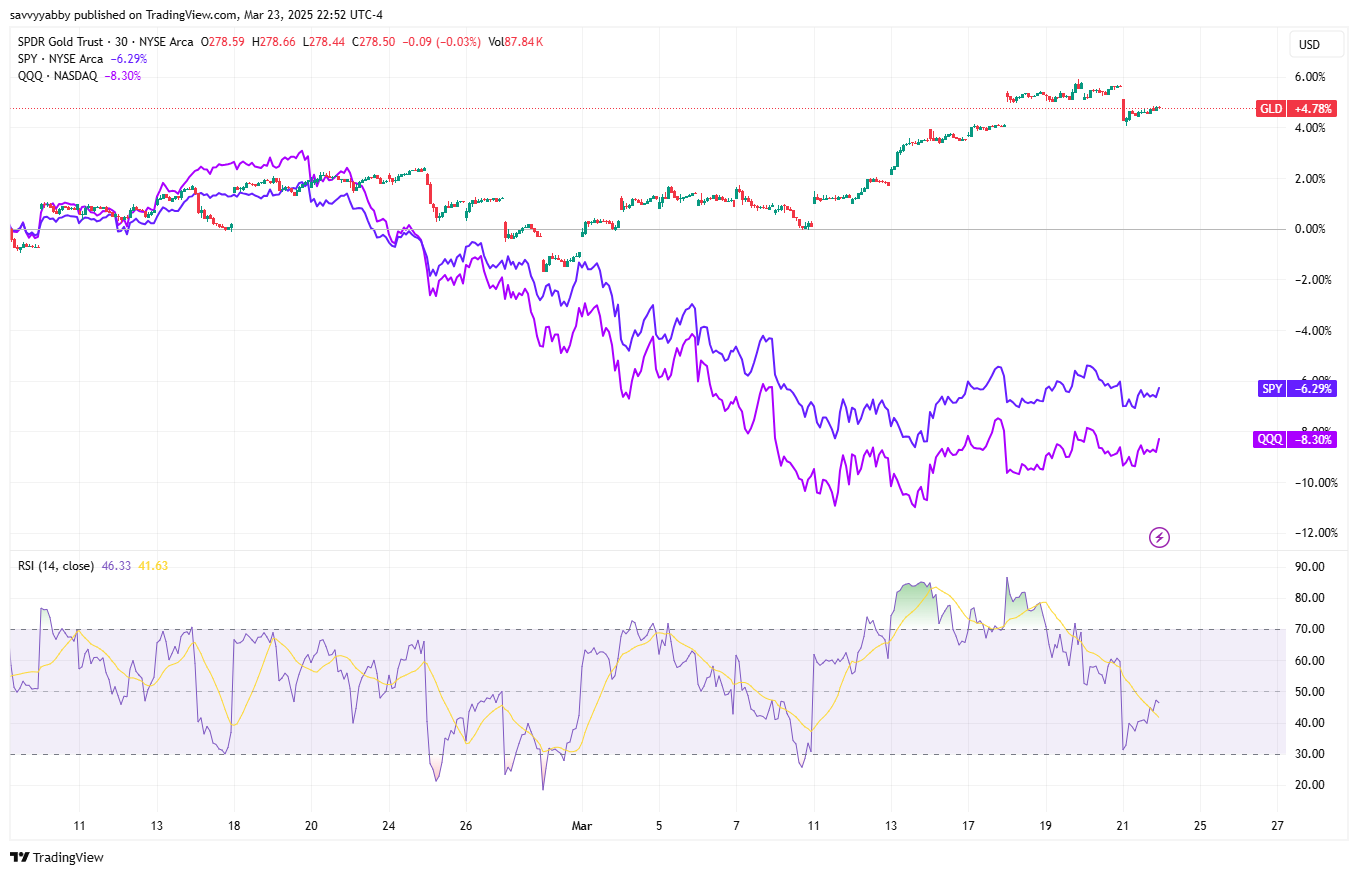
Right now, the US markets look oversold, and gold looks overbought.
Whenever there is a lot of two-way traffic in markets, I find that it helps to look at the ratio of one security to another in a common currency. You can also plot the two underlying securities to see which drove the relative performance, and when
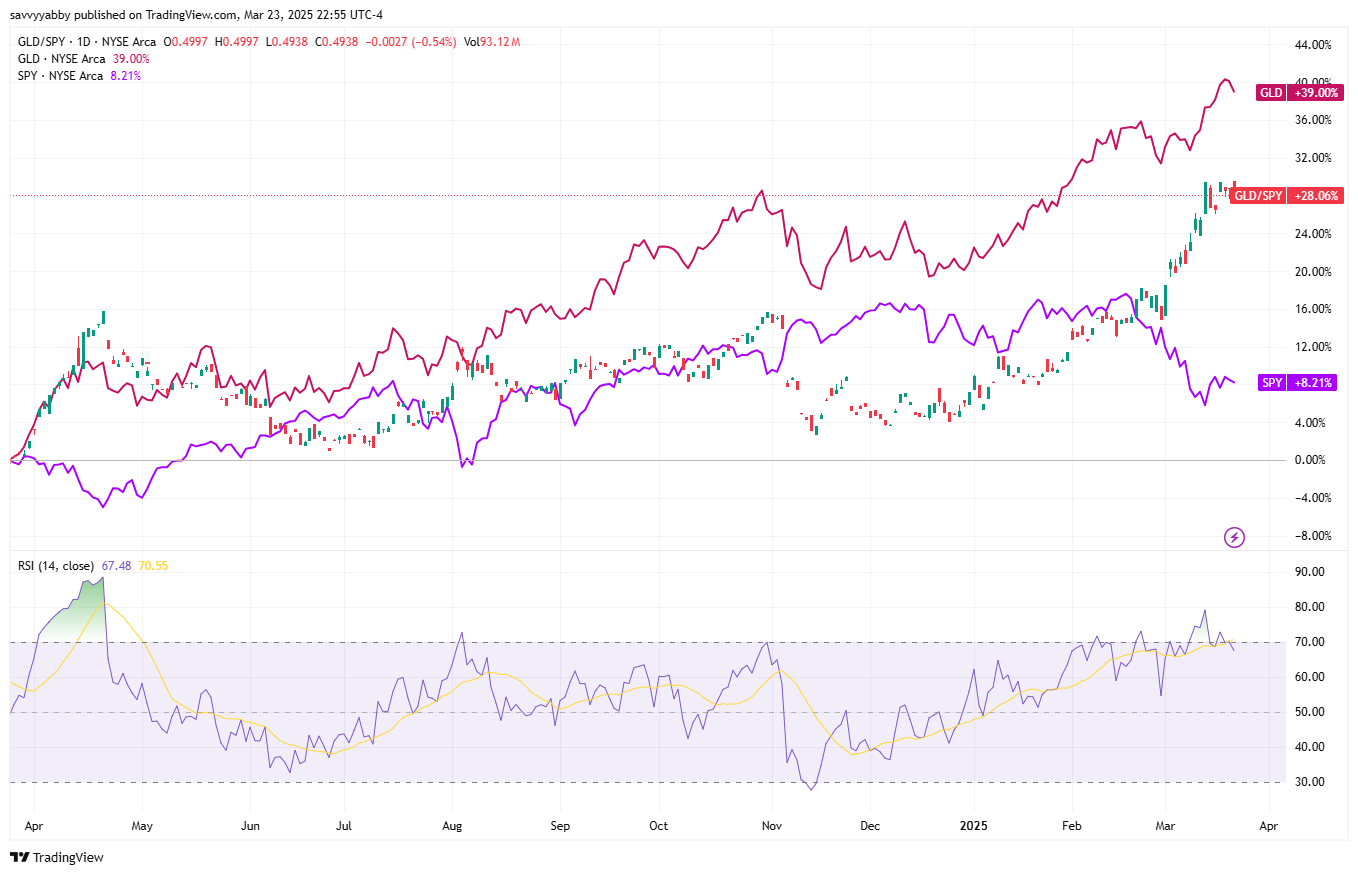
It is a busy chart above, but you can see that gold versus the S&P 500 (GLD/SPY) is up 28% over the past year, with gold, GLD, up 39% and the S&P 500, SPY, up 8.2%.
Notice that there is a standard Relative Strength Indicator (RSI) plotted below, keyed off the relative price. When that is over 70, the pair is overbought, and when it falls below 30 it is oversold. Such indicators are not sure fire, but they are useful.
You can see that gold was well overbought versus the S&P 500 in late April 2024, was oversold briefly in mid-November 2024 and is now looking overbought again.
Stand back from buying gold at this time and look for a bounce in US stocks.
The attitude I am taking to markets going forward is to be prepared for a major change in the previous trend, namely US Exceptionalism, but to be patient.
Cross the road to a new long-term allocation whenever there is a gap in traffic.
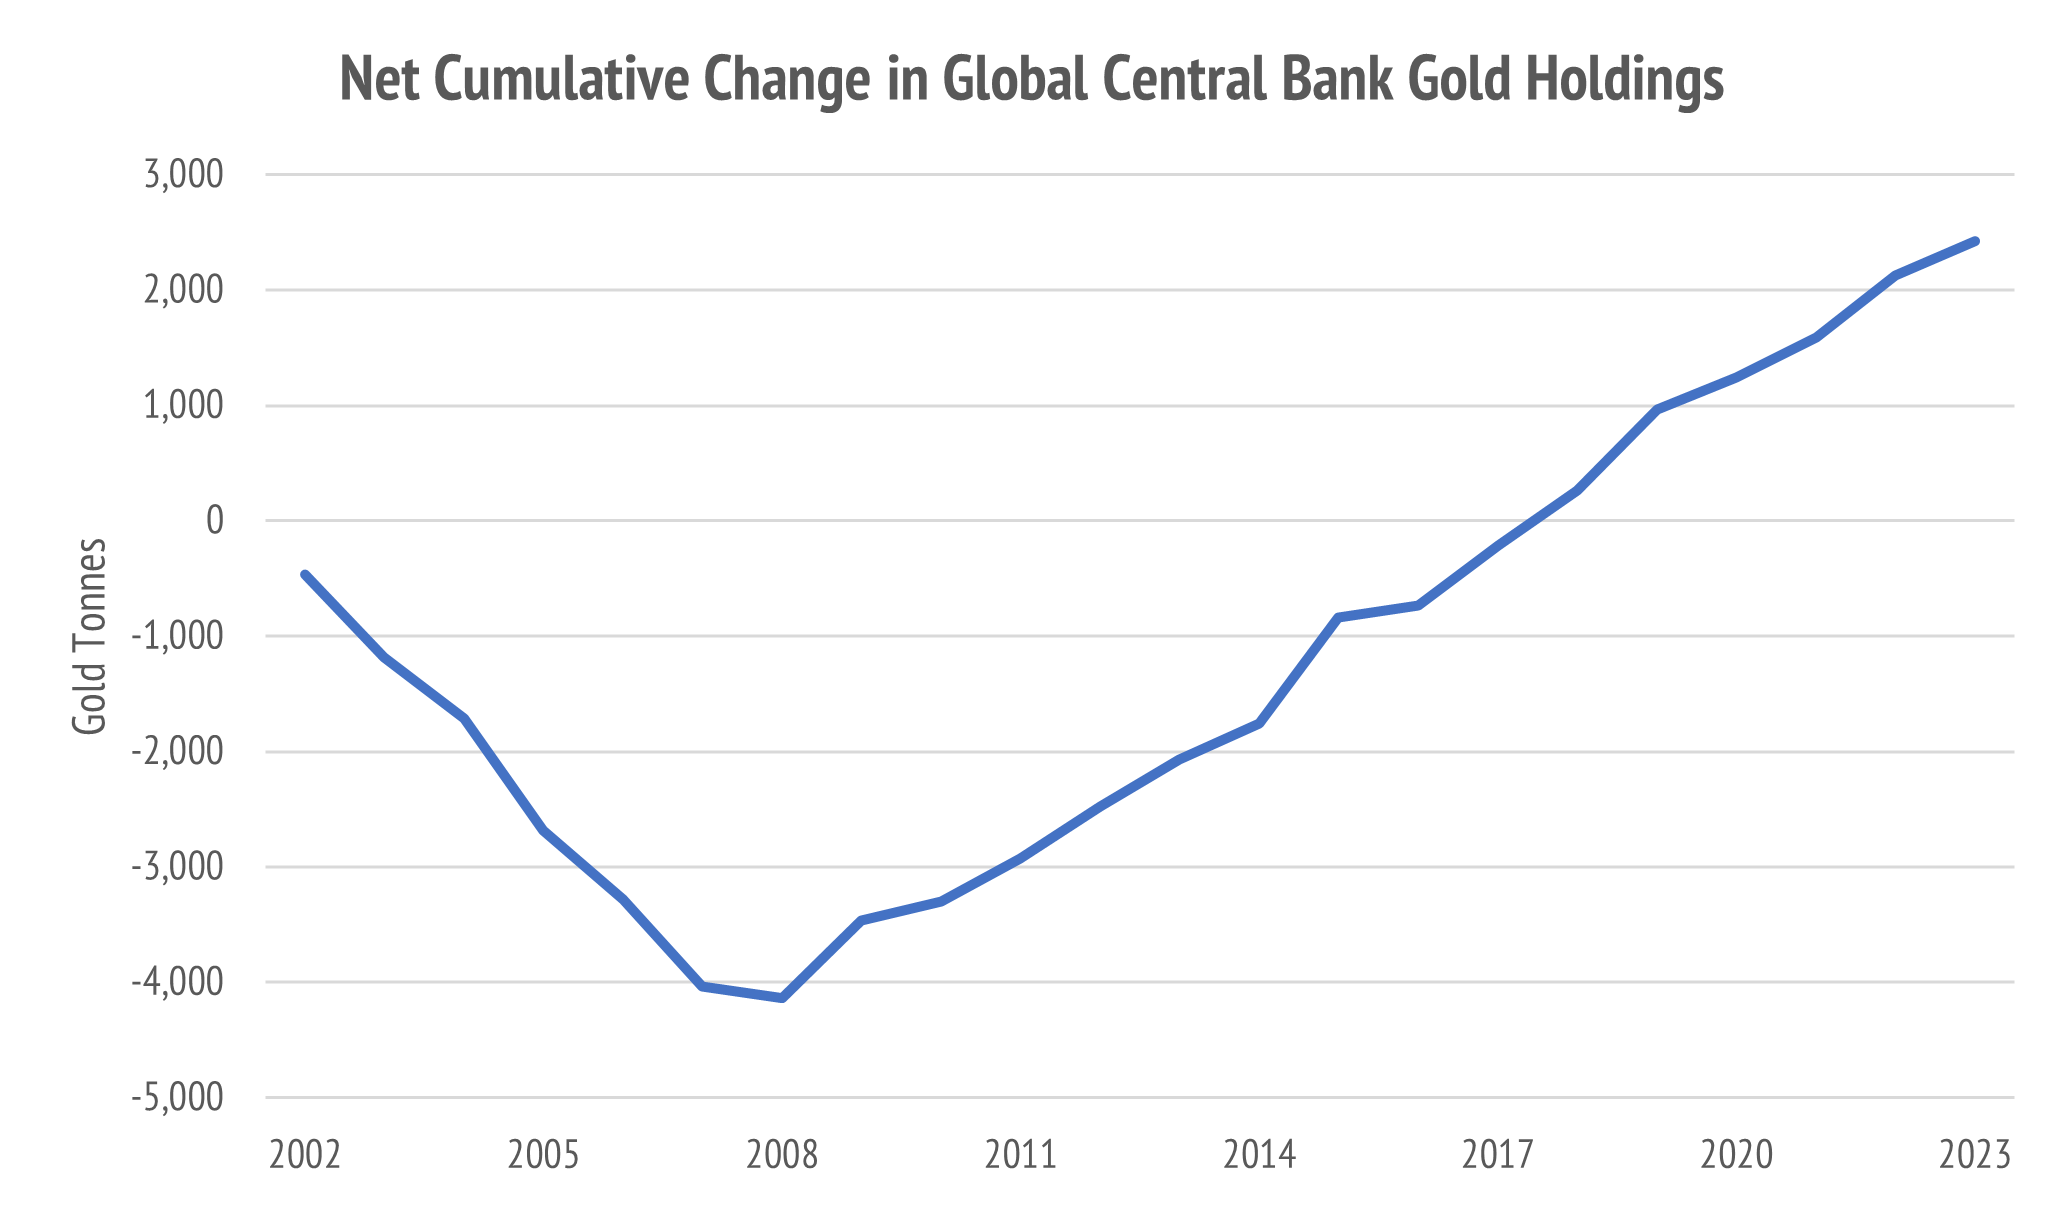
The supporting for gold is global central banks moving from net selling to become net buyers of the yellow metal. The Trump 2.0 presidency put gasoline on this fire.
Gold and gold stocks were a good idea that is actually working.
However, if you are anything like me, you are probably cautious and did not go with a large position early. Now is the time to wait and let a countermove take place.
What about other ideas we had, such as our best idea Walmart XNYS: WMT?
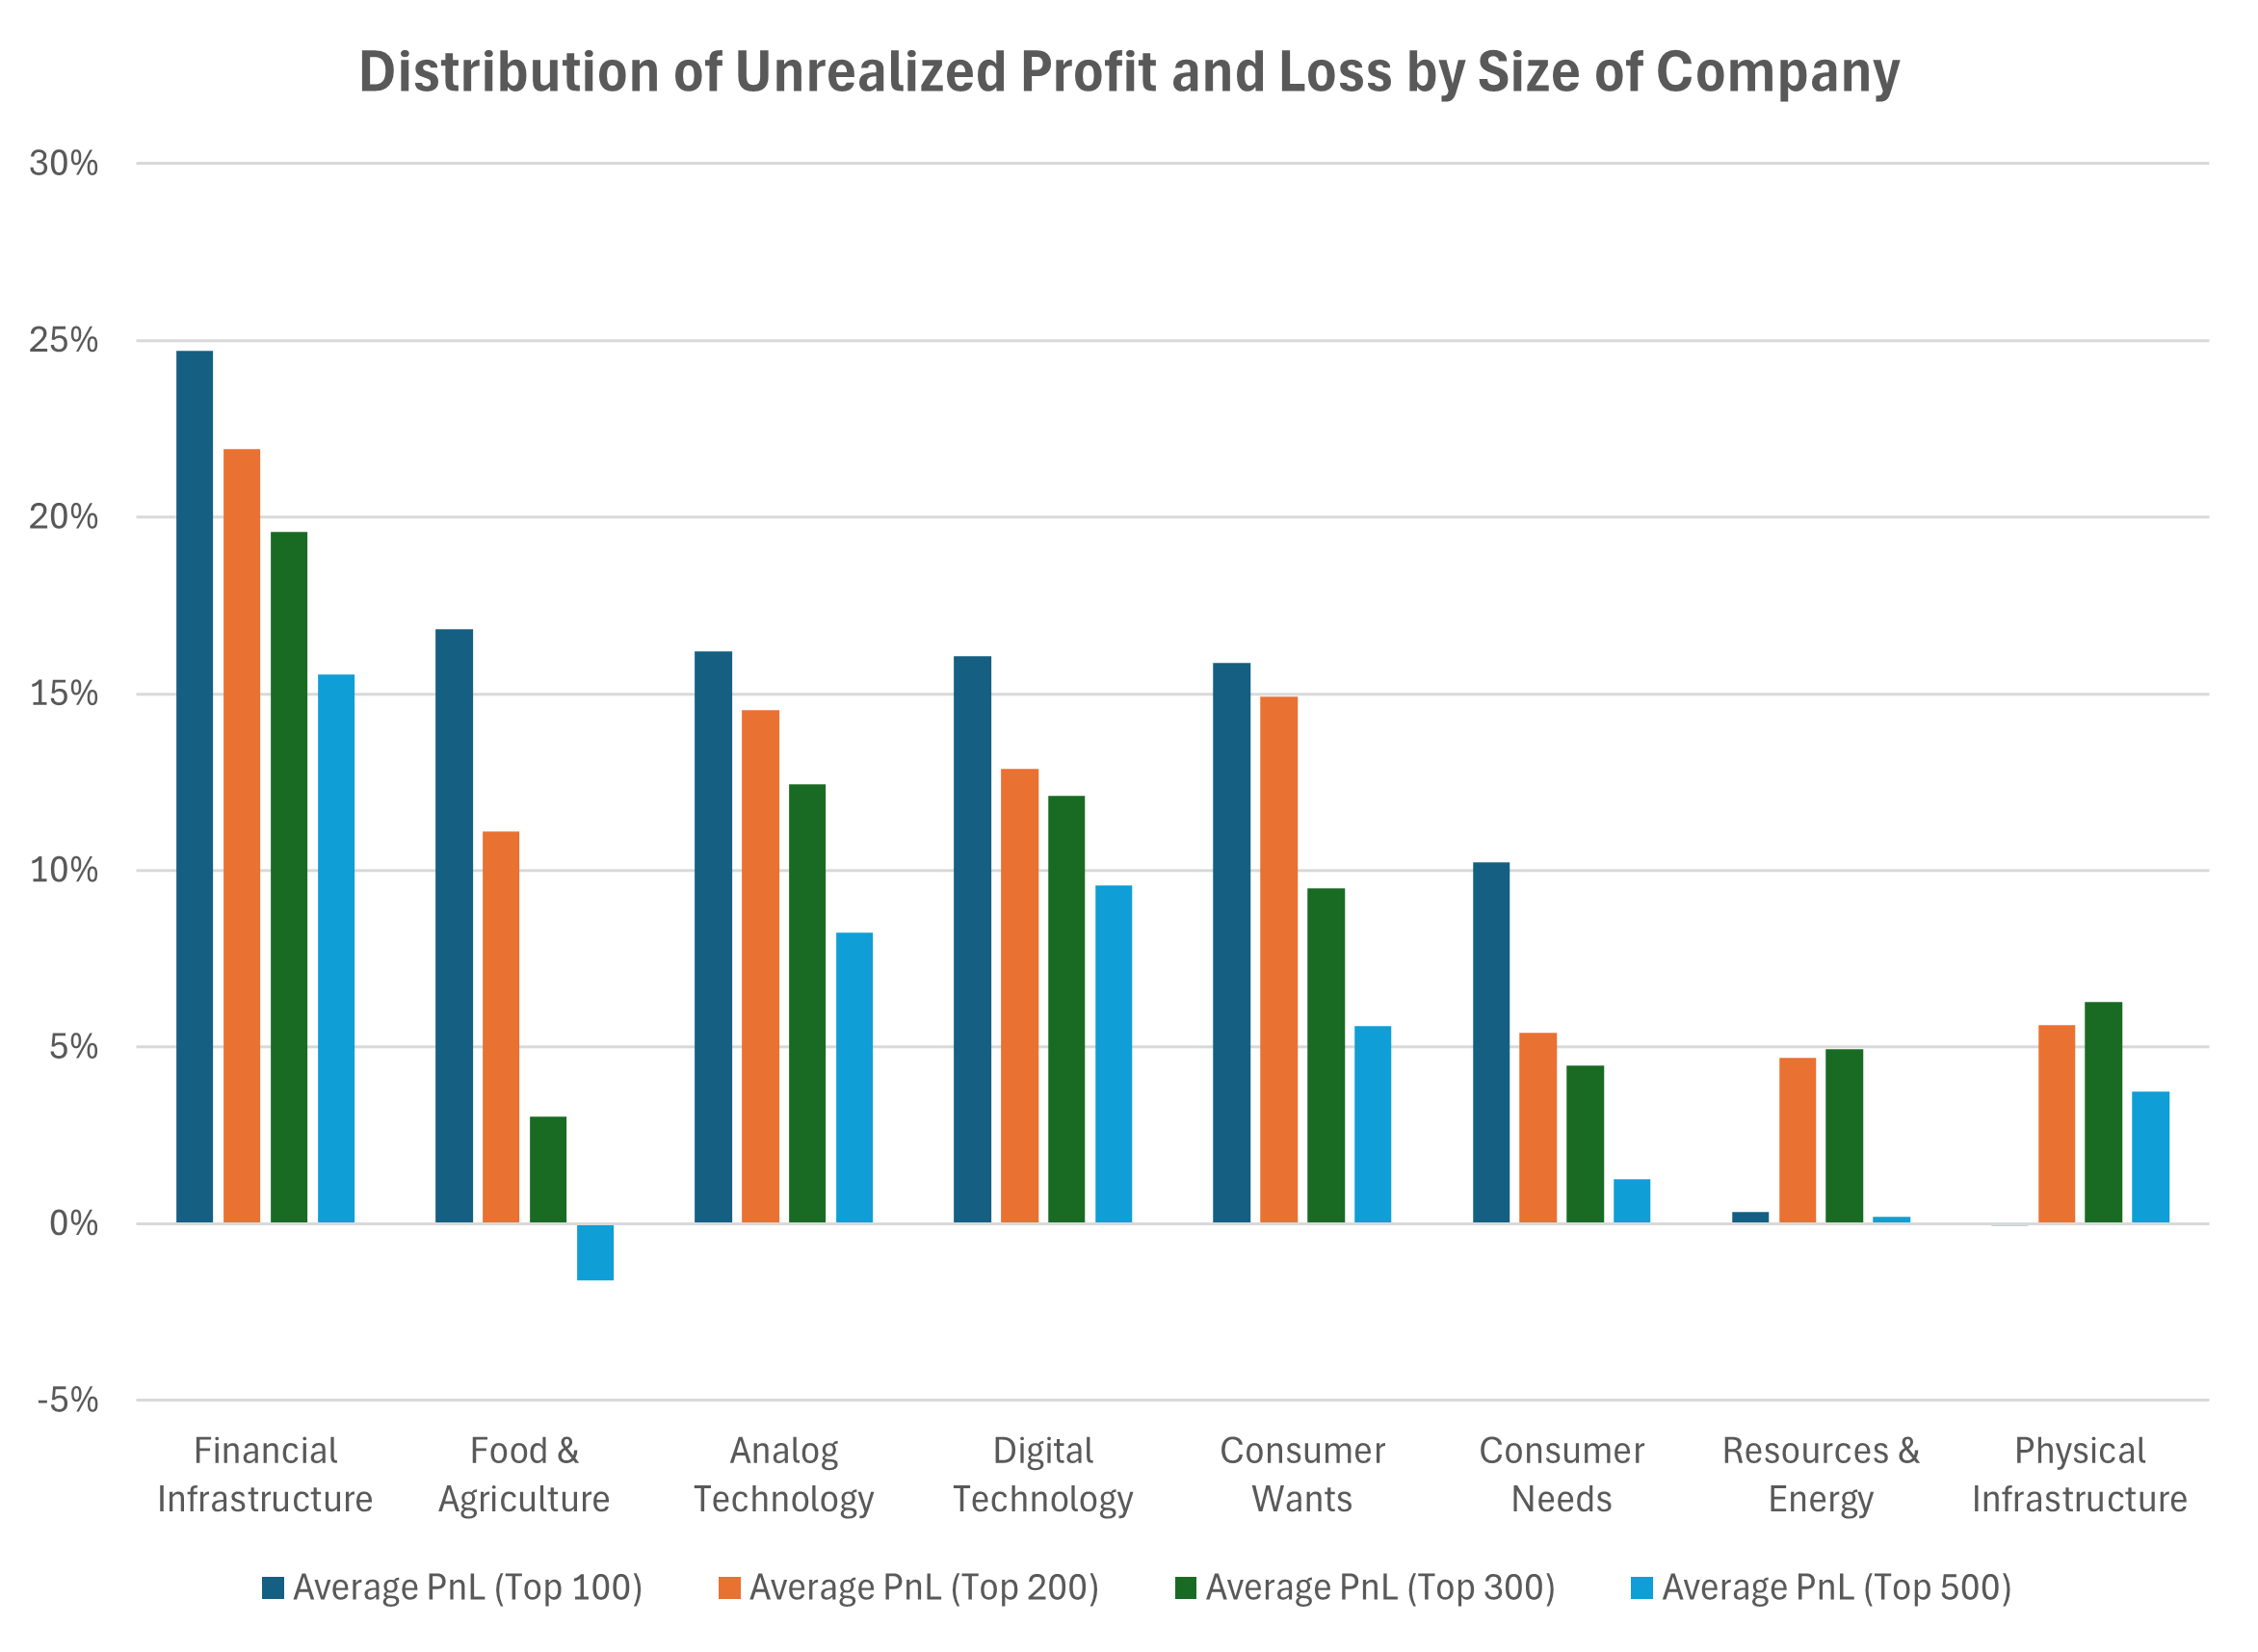
The market condition I wrote about in late Nov-24 was characterized by high positive sentiment across all major US sectors. Recall that the way we measure this is based on unrealized profit and loss from investors who currently own the stocks.
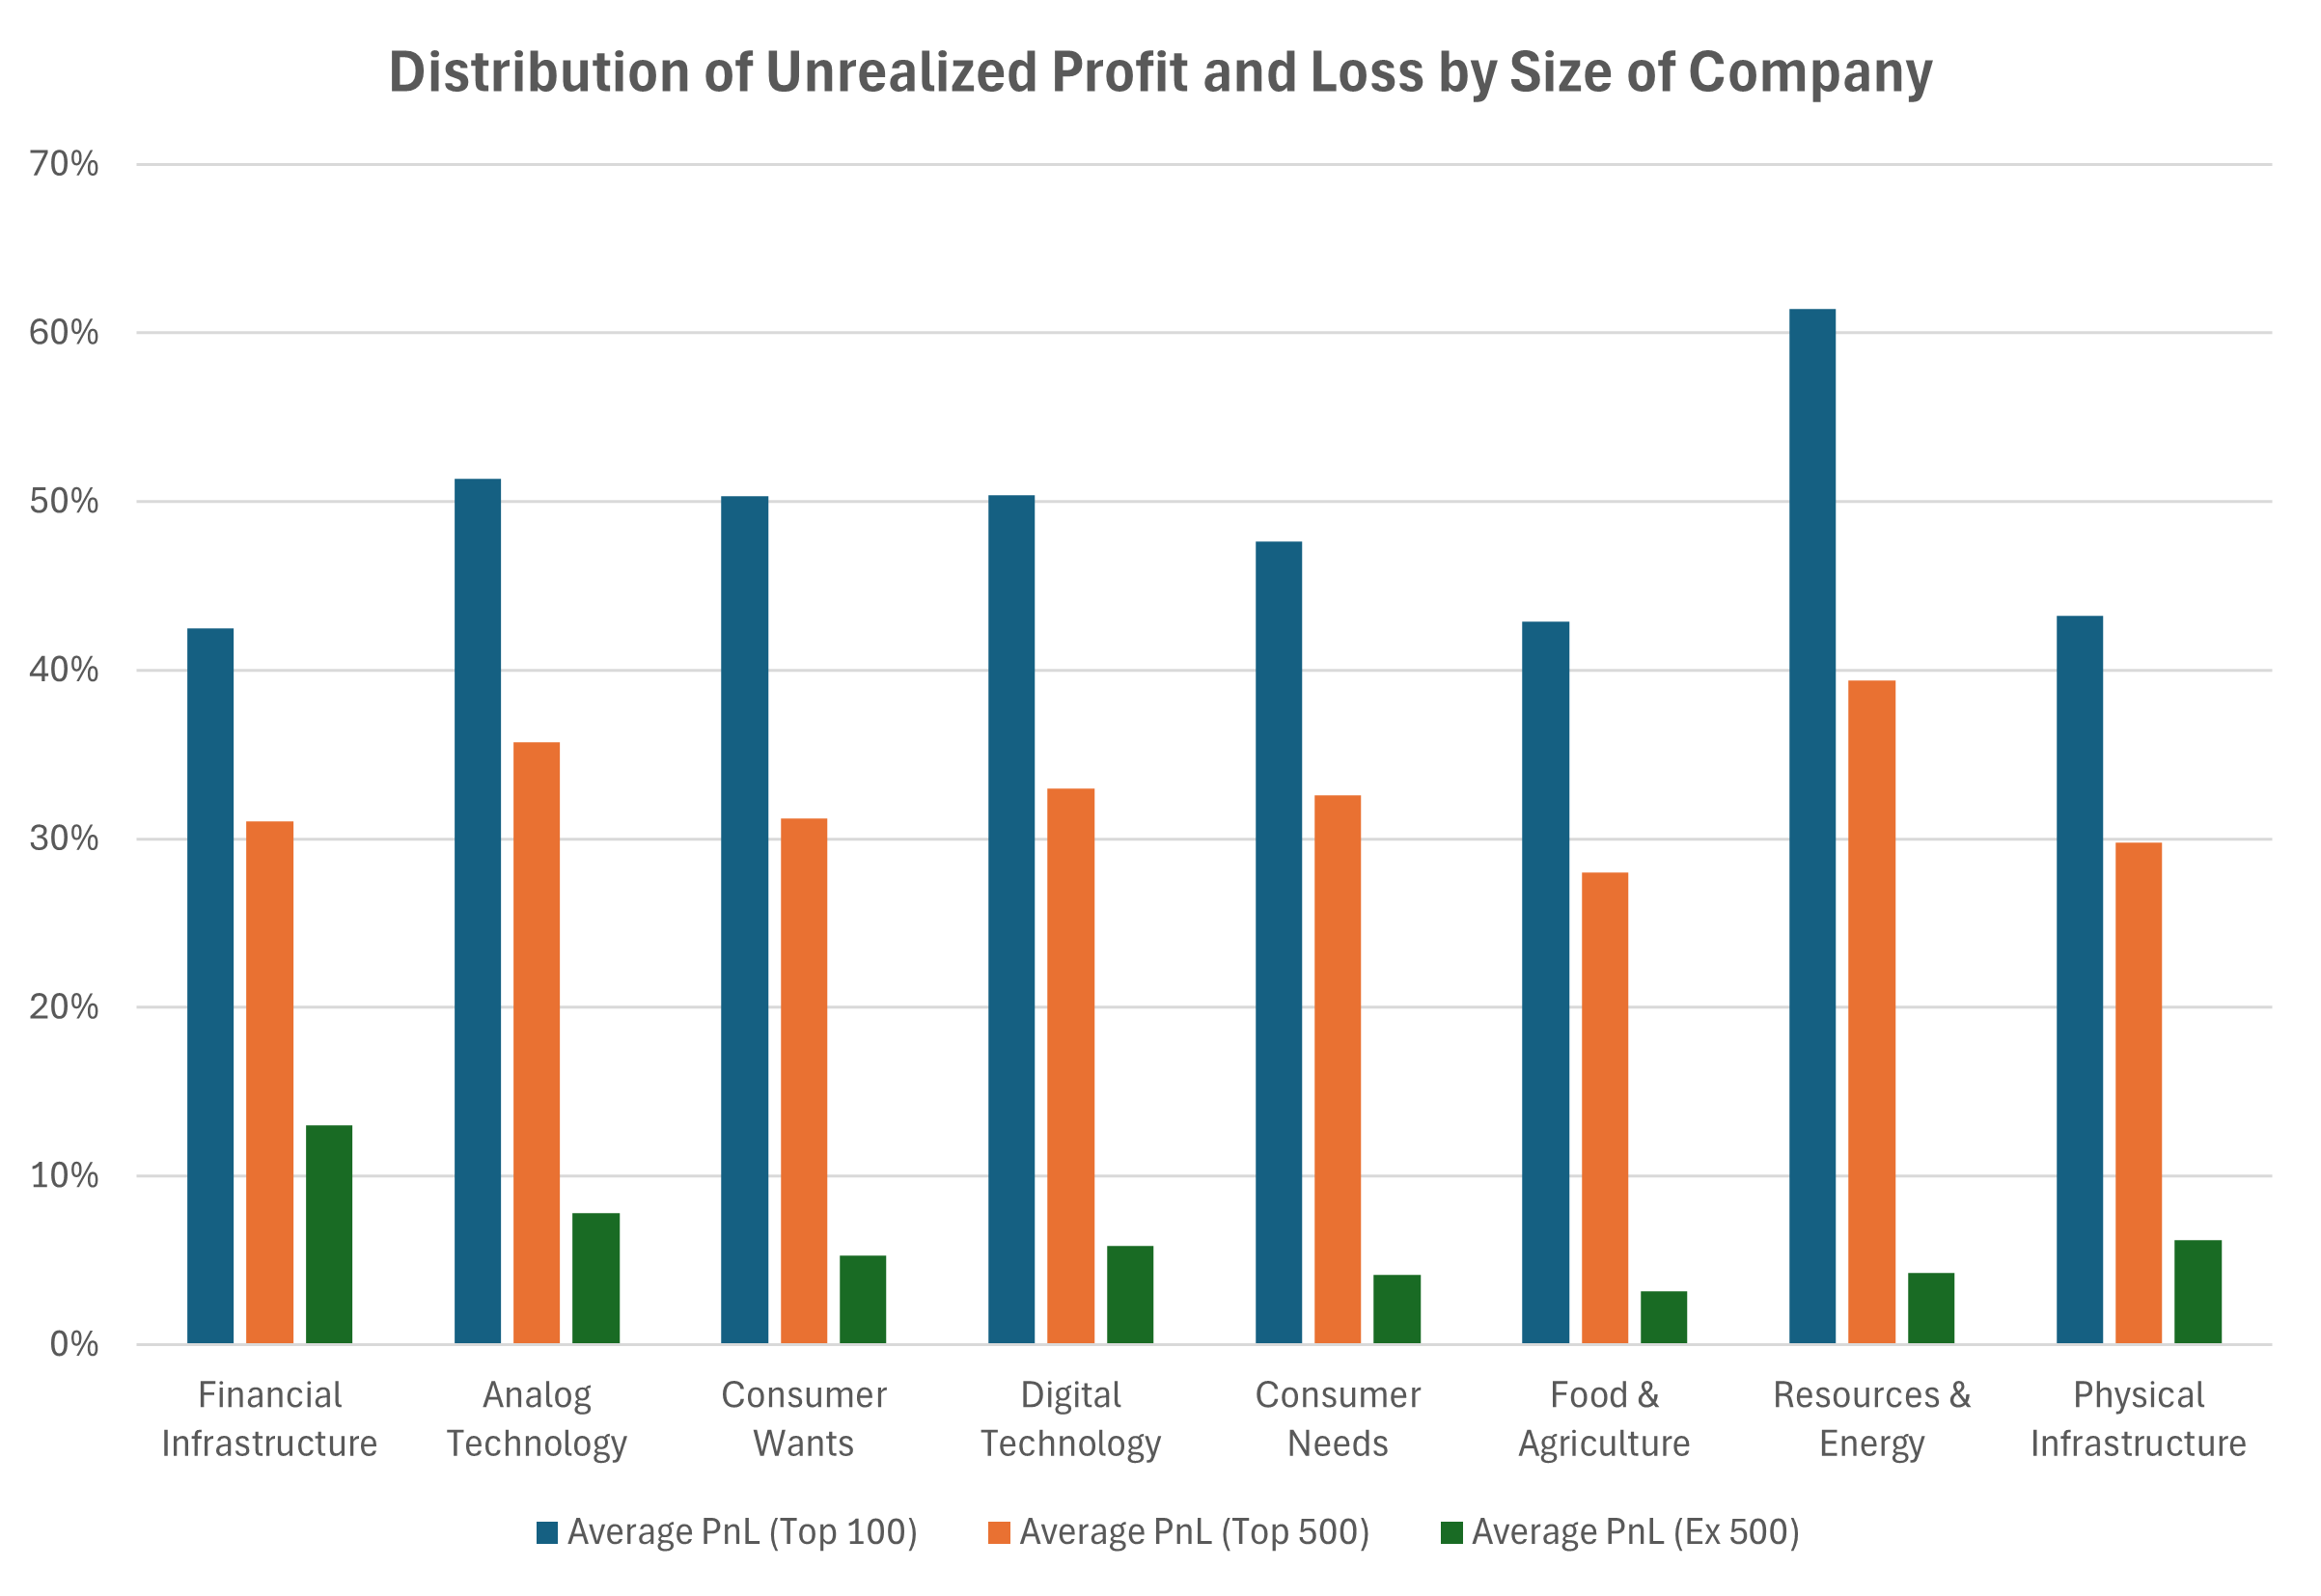
Normal markets have about 10-20% positive unrealized profits in a bull market. Late last year the US market was extremely positive, with large-cap unrealized profit at around 40% to 50%. Walmart was our best US stock idea, at that time.
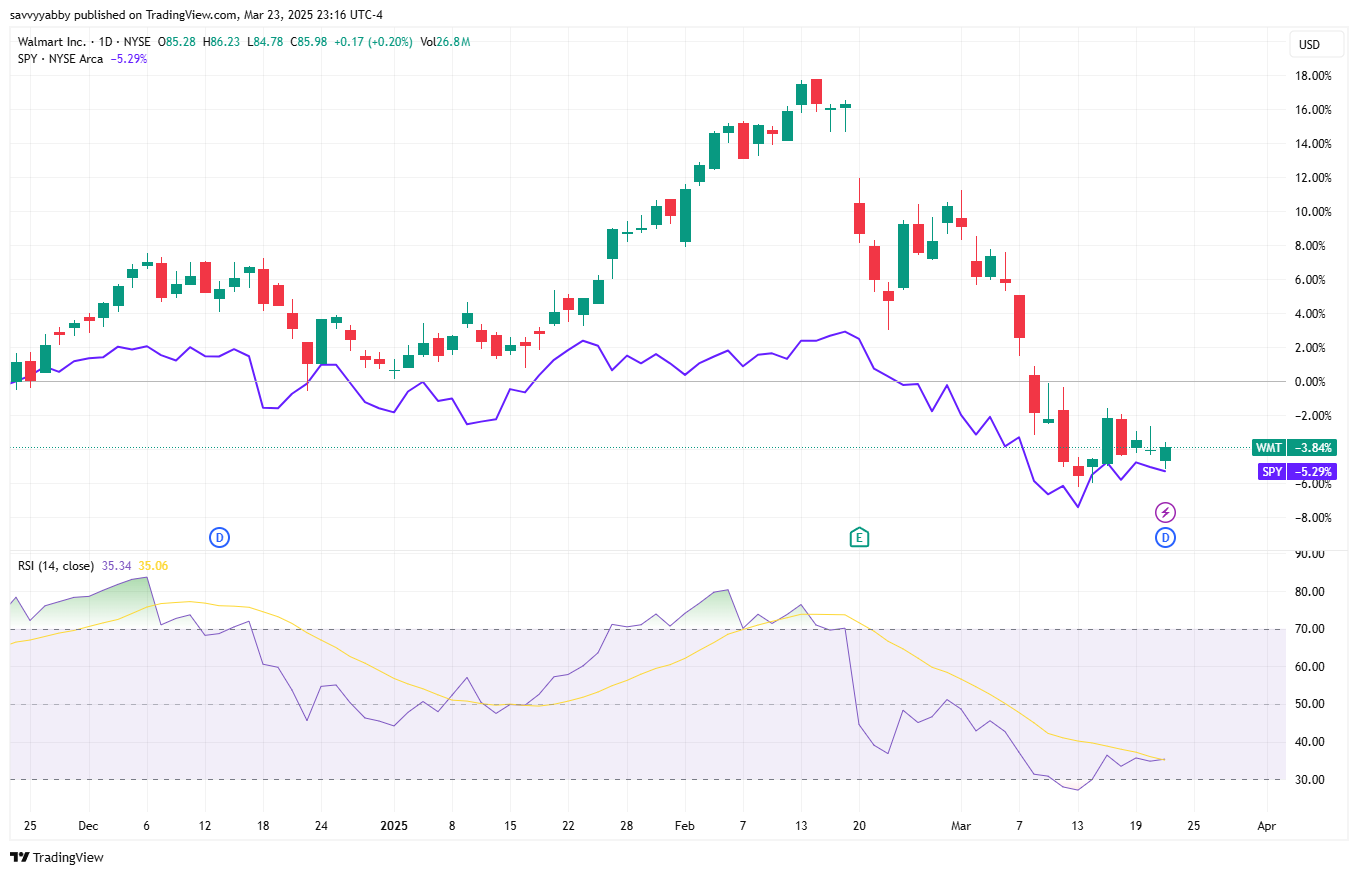
Indeed, Walmart has outperformed the S&P 500, by a very slim margin, but both are down 4-5% since the 24-Nov-24, when we published our selection.
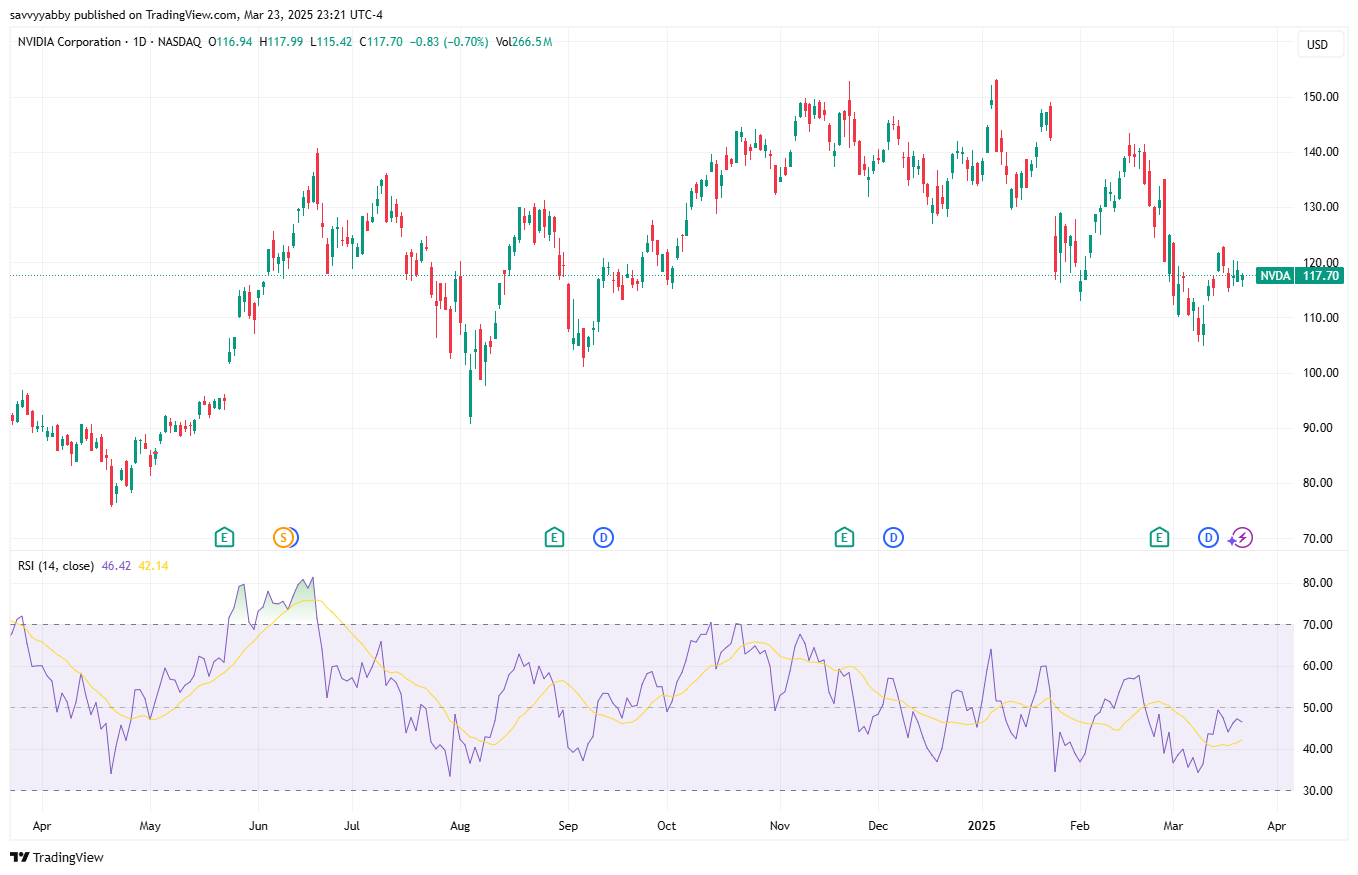
Notice that the story was very positive up until 14-Nov-24. Walmart peaked then, and the S&P 500 peaked a few days later, on 19-Feb-24. For comparison, the AI market darling, NVIDIA XNAS: NVDA, hit an all-time high on 7-Jan-25.
When leaders top ahead of a broad market top you should be wary of a possible major reversal in the former trend condition. Our November piece on Walmart reported broad positive sentiment, as measured by unrealized profits.
In my view, Walmart is not yet a sell, nor the broader market, but we must be alert to why this selloff in US stocks was accompanied by buying of foreign stocks.
We had mentioned our circumspect attitude to what the Trump 2.0 presidency may bring in the inauguration day piece Asset allocation in a time of uncertainty.
In that piece, we named the S&P 500, Gold, and Short-term Treasury Bills as our three go to assets to play with when framing the core of our positioning.
Nothing in markets is certain, and the release of Chinese AI model DeepSeek set off what soon became a Deep Panic. From the first panic, NVDA stock collapsed, but a relief rally carried us back, along with the broader market, until mid-February.
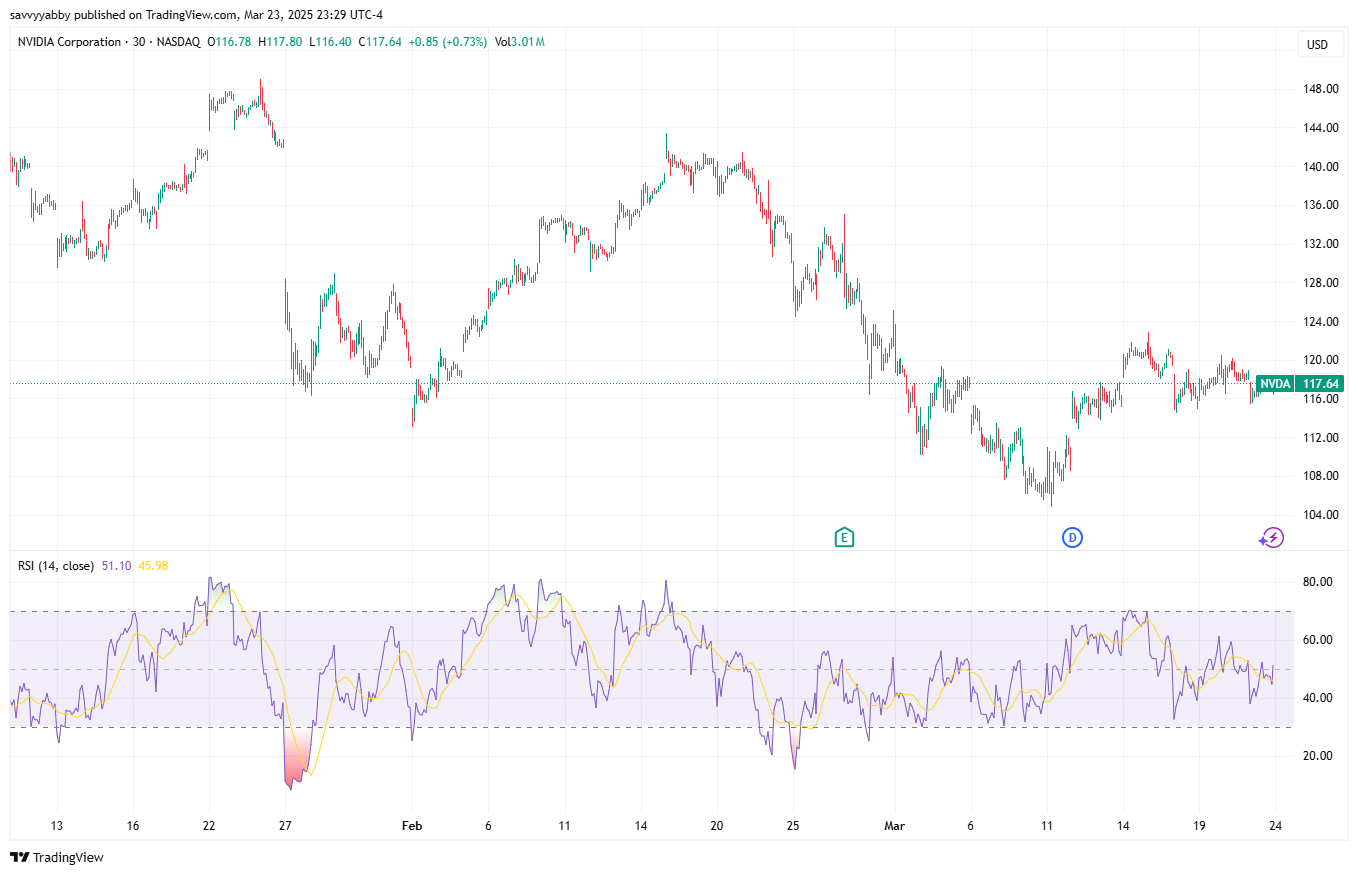
NVIDIA is now trading around the panic lows of Monday 27-Jan-25.
This fall from grace is another warning sign about the health of the US market.
NVIDIA is a widely held institutional market darling, and it just beat earnings. The wise thing to do, in these conditions, is to look at what the market chose to buy instead.
Why the sea-change in sentiment?
Firstly, one should note what real events may have caused investors to change their mind on the most overbought theme in memory: US Exceptionalism.
There was a clue with the response to Trump tariffs from mild mannered Canadians.

Canadians redefined US Exceptionalism as:
“That Exceptionally Annoying Neighbor.”
One would not be so shocked if this was Mexico, or China.
They have their own baggage with the USA to carry.
However, Canadians are usually ever so polite and accommodating.
The Canadian Moose is now officially pissed and so goes the World.
In Everything has gone Gothic, we reprised our November sentiment chart.
Notice that the unrealized profit buffer had shrunk a lot. This is not only because the S&P 500 had fallen around 6%, but because there had been substantial trade in the underlying stocks as buyers followed the market up to the mid-February high.
It is one thing to notice that North America, specifically the USA, Canada and Mexico may undergo some significant economic disruption from Trump’s tariffs.
The global investor community is now nervous about holding too much negative exposure to whatever happens within the North American economy.
This follows a long period where investors stayed away from Europe and Asia on the view that US Exceptionalism would reward a concentrated US stock portfolio.
How to adjust the asset allocation?
To answer this question, we should be alert to the second-order effects.
Who may benefit from a deep change of investor sentiment towards the USA?
There is only one world, and investing is a relative game.
As I discussed in my piece Going global with ETF product, the USA was then around 70% of global equity market capitalization in typical institutional benchmarks.
This means there is a huge underperformance risk in not owning US stocks.
For most Australian investors, there is a different way to frame such risk. We did so by comparing the Australian S&P ASX 200 XASX: IOZ to the S&P Global 100 XASX: IOO.
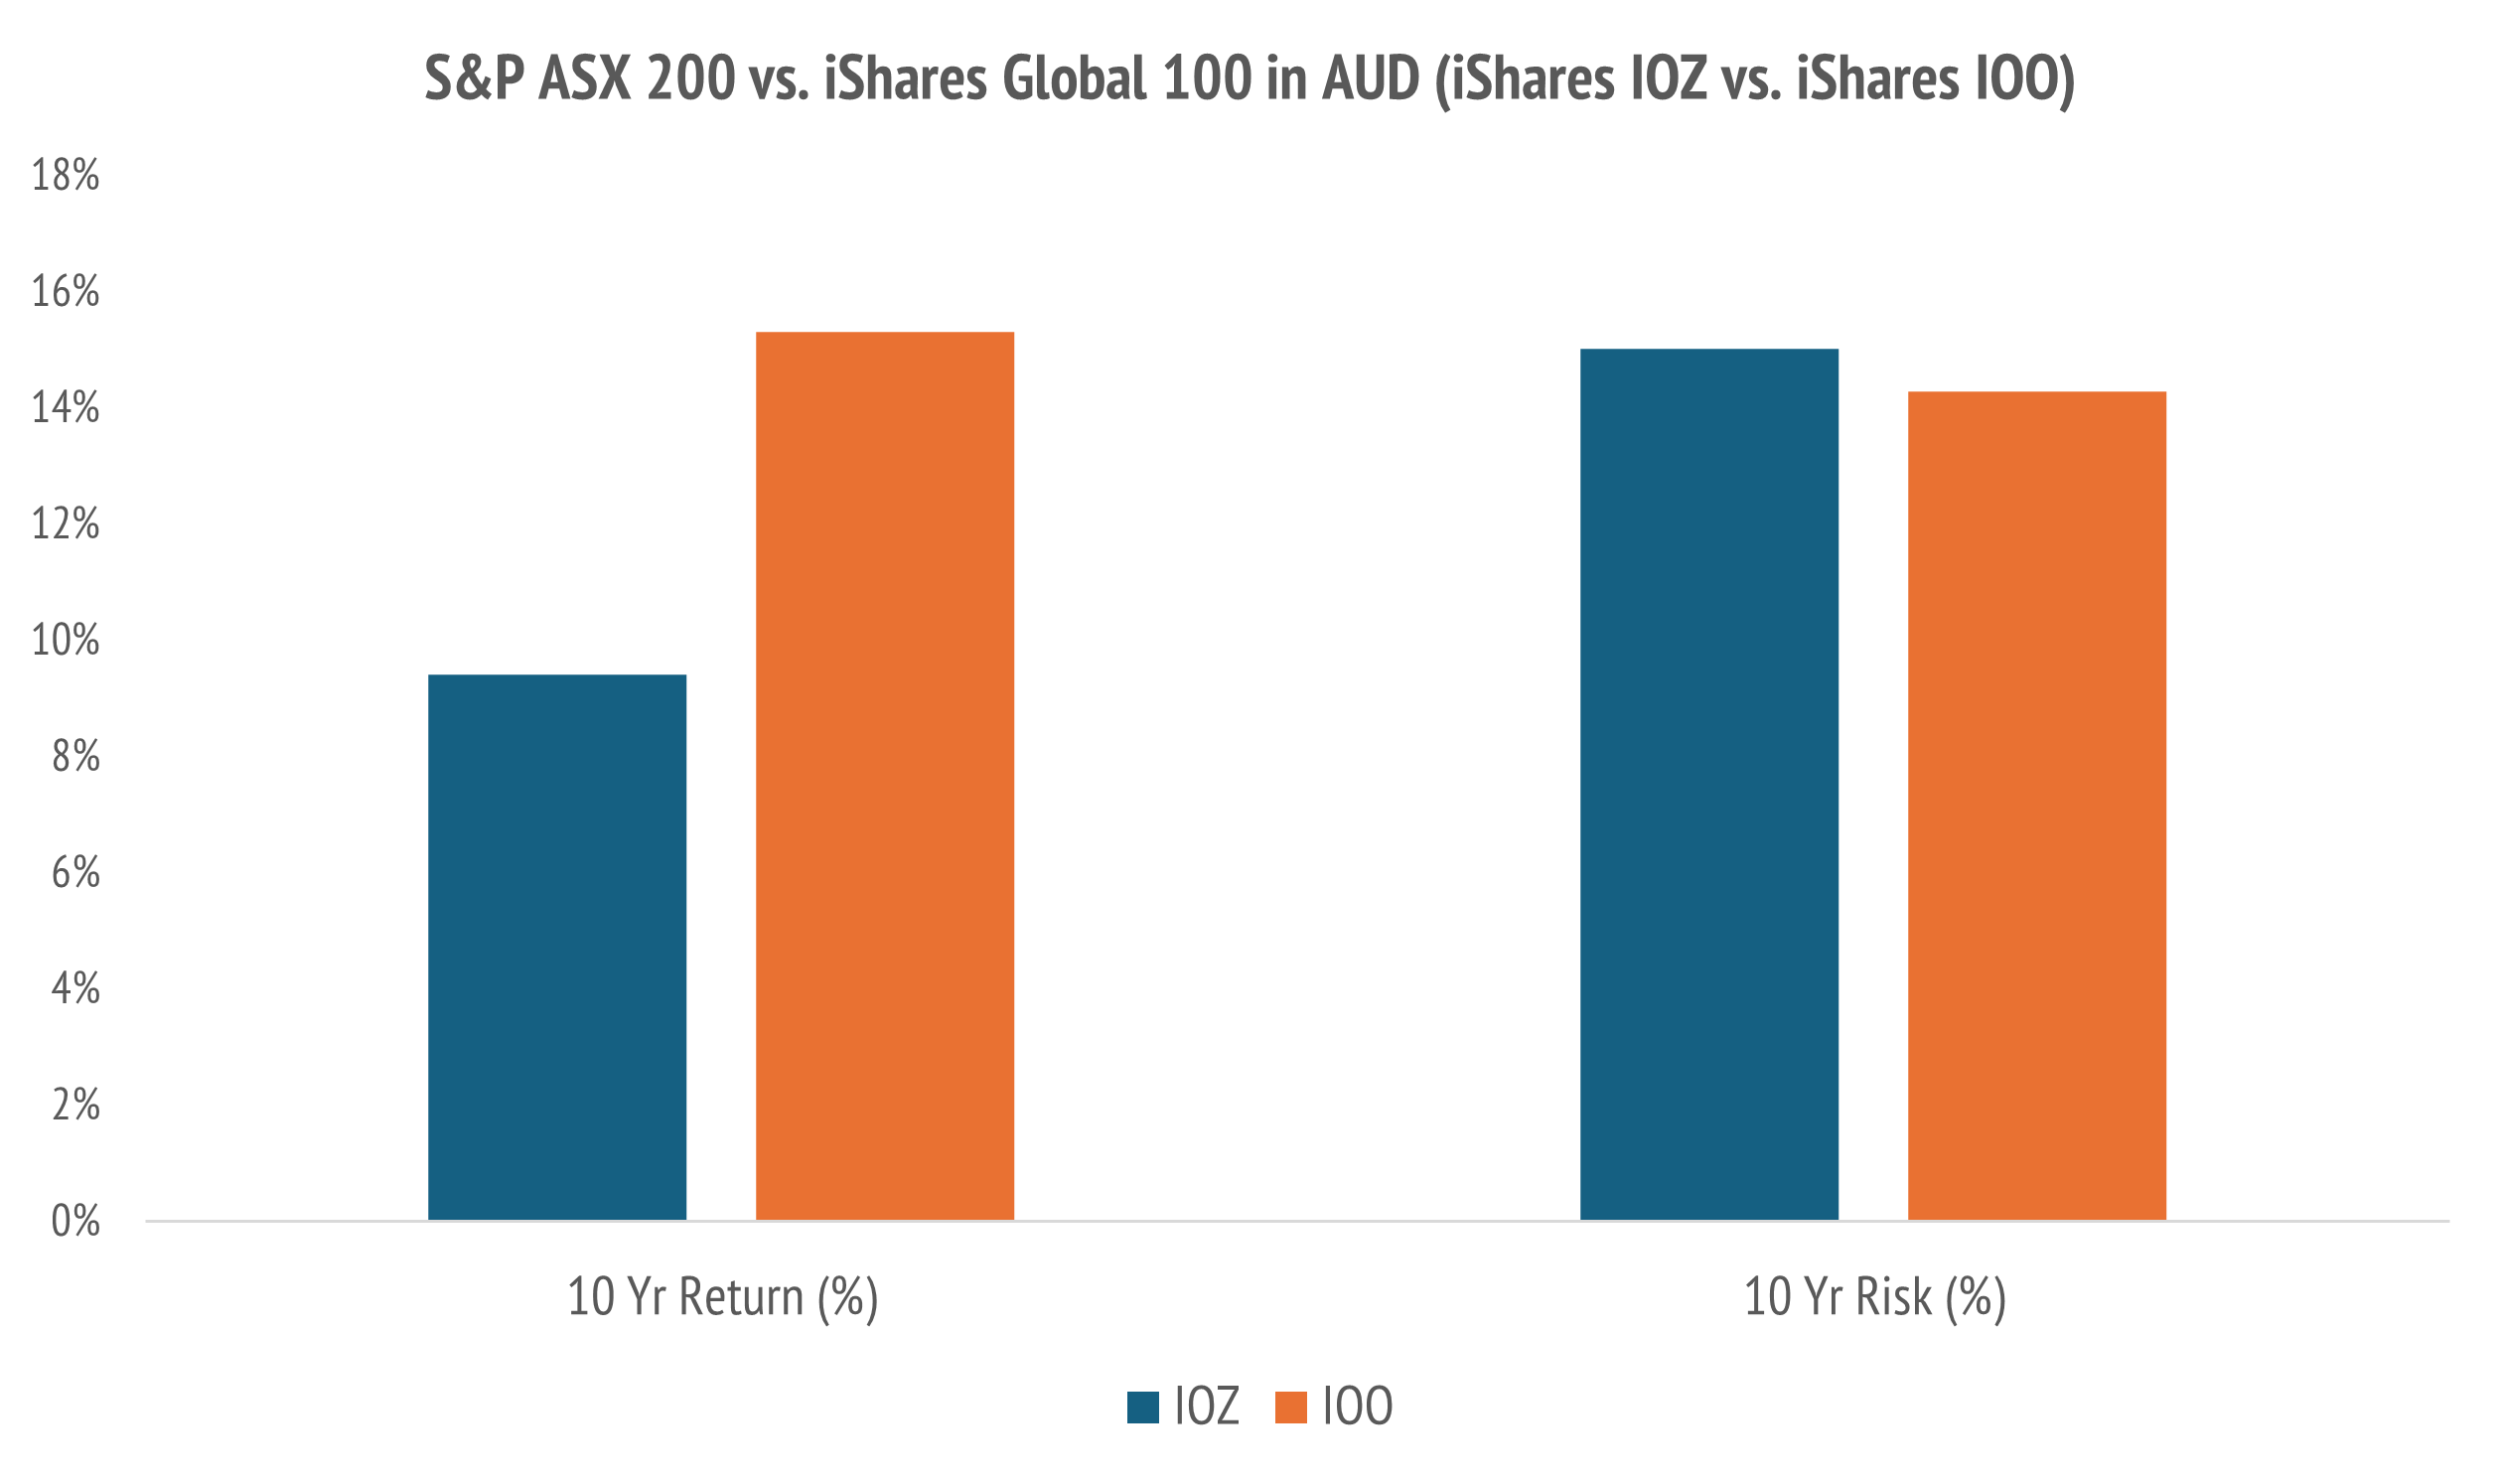
Ove the ten years, as at my 17-Dec-24 publication date, there was nearly 6% return on offer by choosing to buy the S&P Global 100 over the local S&P/ASX 200.
These are apples to apples comparisons, measured in Australian dollars, and allowing for the average franking credit received on the Australian franked dividend income.
For those who favor a quantitative perspective, there is both a risk and return benefit from holding a diversified equity allocation, with some global stocks.
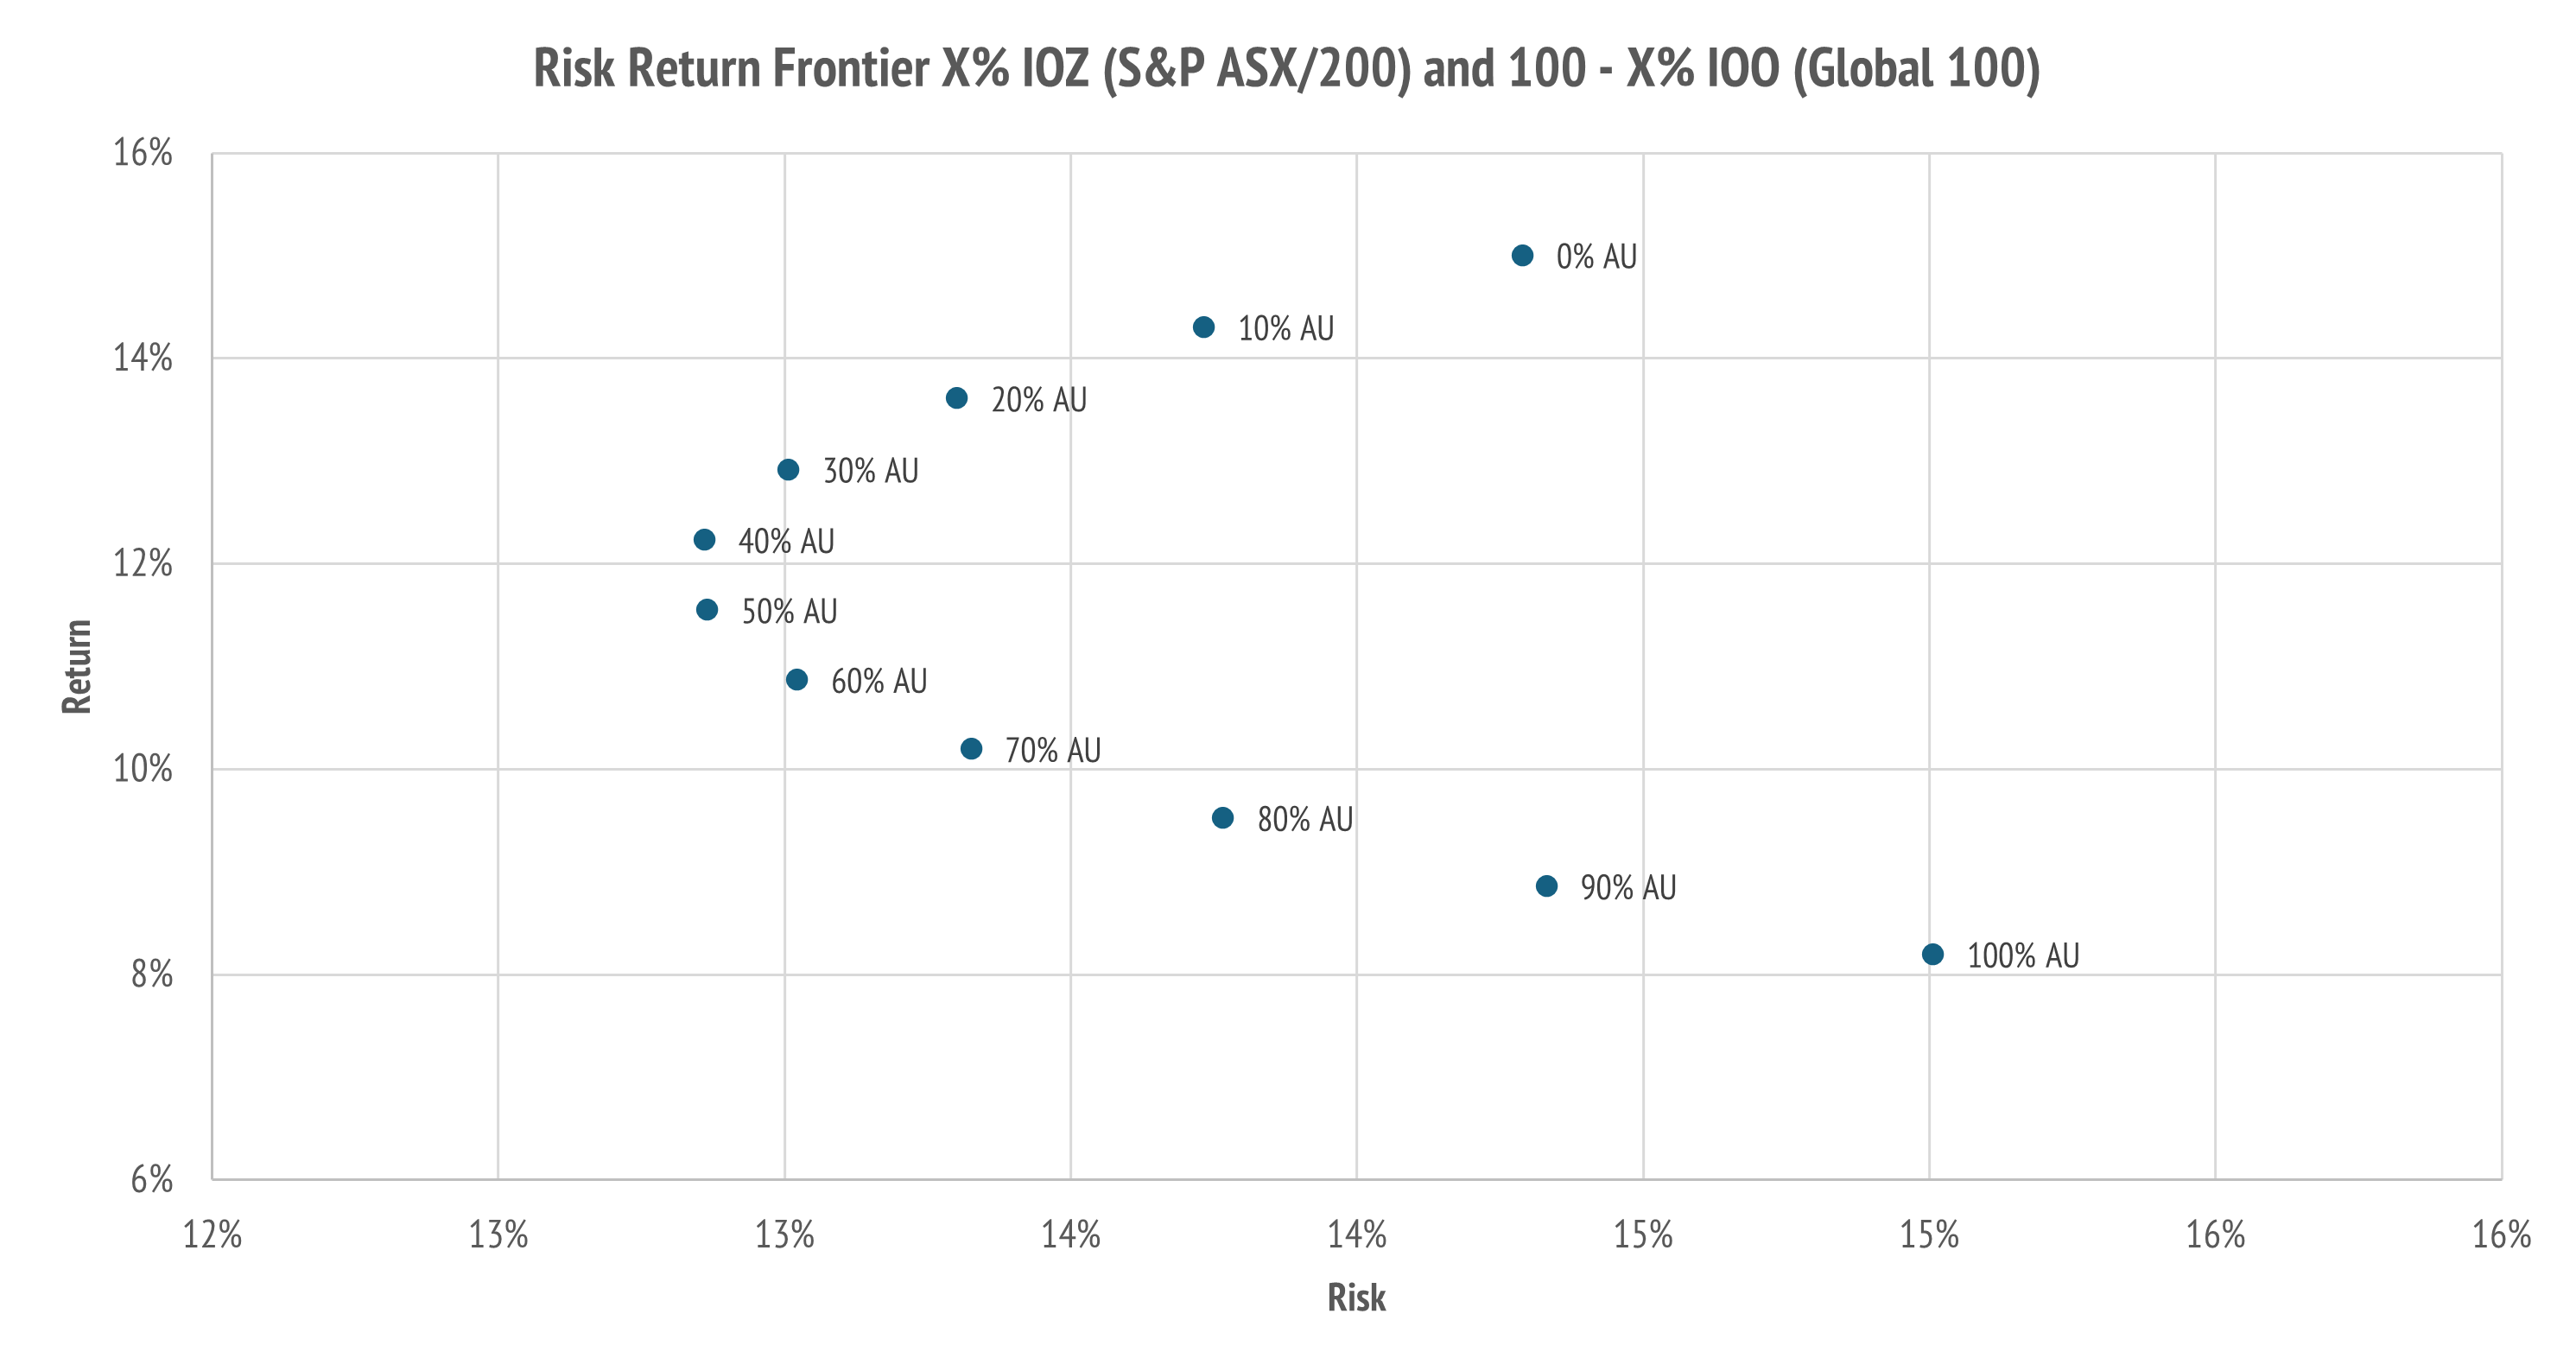
The above chart quantifies the diversification benefit over ten years. The lowest risk is to hold about 40% in Australian stocks, and about 60% in non-Australian stocks.
In my follow-on ETF piece, Unboxing our KISS portfolio: IOZ+IOO, I showed the stock portfolio corresponding to 40% IOZ (Australia) + 60% IOO (Large cap global).
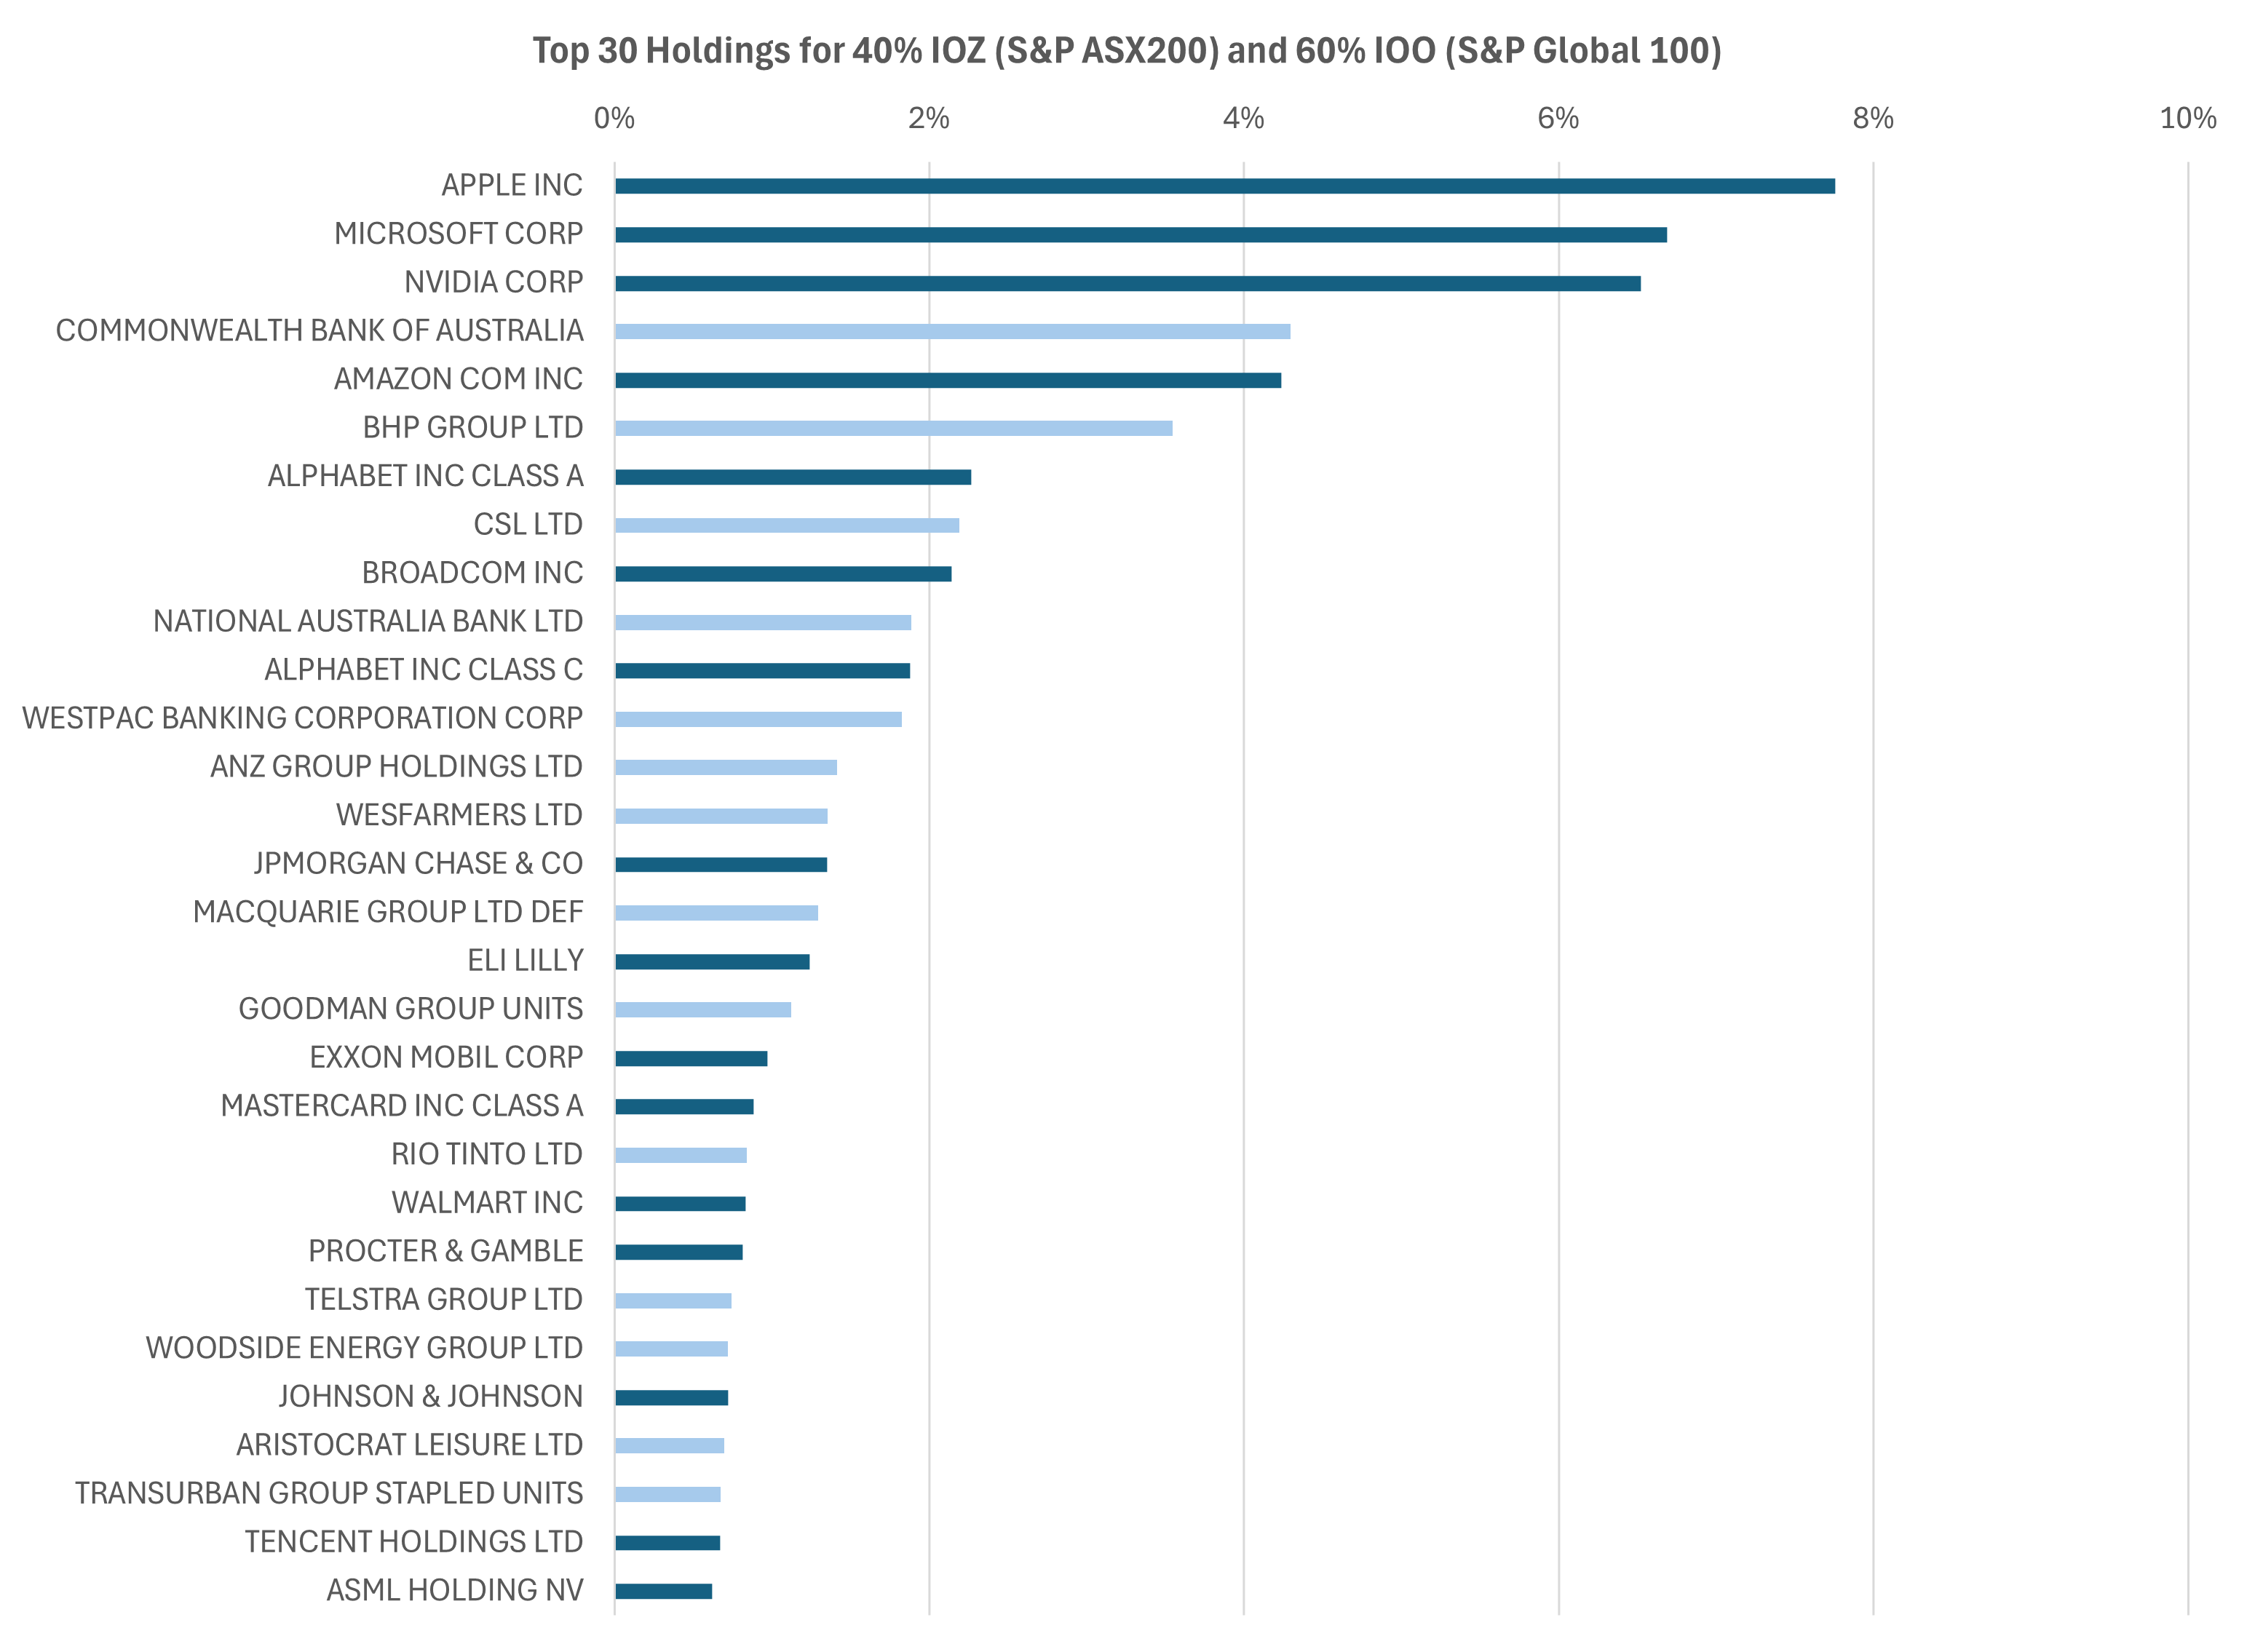
The US heavy nature of this portfolio is very clear.
Doctors have their Hippocratic oath:
Do no harm.
Portfolio managers have their own version:
Whatever the harm, know who to blame, and when to get out of Dodge.
The profession aspires to do better but does not know how to forecast precisely.
Since I have been doing this for nearly three decades, I have a good sense of when to start crab walking to the fire exit, and how to frame the blame game.
That reminds me of the surge of buying in China Tech and European Financials.
It is better to be late than buried at Boot Hill because you failed to get out of Dodge.

Of course, I exaggerate, but the Wildebeest are clearly crossing the river.

The “other side” of this great migration in global markets is not that radical. It does not mean selling everything you own in US markets. Nor does it mean buying all hopeful China-listed AI stocks, or every European defense conglomerate.
However, it does mean selling some of what you do own in the USA, presuming you own some, and have judged that you need to sell some to buy non-US stocks.
You can tell that the KISS portfolio of IOO + IOZ is missing something from the relative performance since we recommended that on 20-Dec-24.
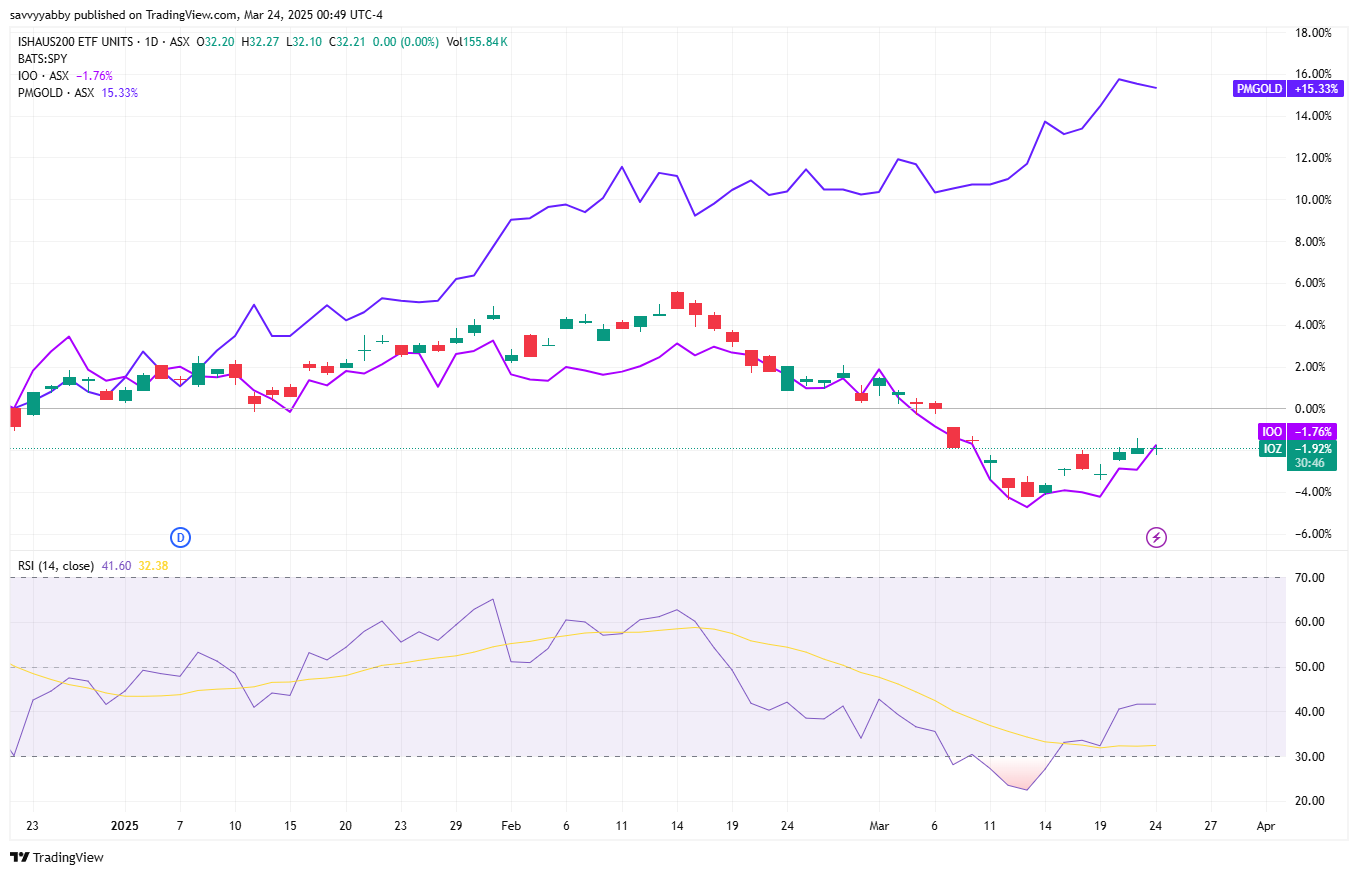
You can see that gold whipped the straight equity combination of IOO+IOZ, while there was no harm done owning IOO versus IOZ, and vice versa.
Let me reprise something I wrote in our first ETF piece.
Core-plus-satellite investing is fancy way of saying two obvious things at once:
It is good to have some investments working for you over the long term
The world changes so there will be opportunities in the shorter term
The longer-term buy and hold assets go into the core portfolio.
The shorter-term trading assets go into the satellite portfolio.
There is an obvious connotation with our solar system.

Remember that US stocks are currently about 70% of most global equity benchmarks, and slightly more than that in the S&P Global 100, IOO. You do not need to panic and make any wild moves in the portfolio. This is a job for a few good satellites.
A few good satellites
In our inauguration piece, Asset Allocation in a time of uncertainty, we focused on gold GLD, the S&P 500 SPY, and US 90-Day Treasury Bills SHV, as our core ideas to allocate between. Now the market action is suggesting to us the key satellites.
In my last piece, China Tech and European Financials, I mentioned two US listed ETFs, namely China technology XNAS: TCHI, and European Financials XNAS: EUFN.
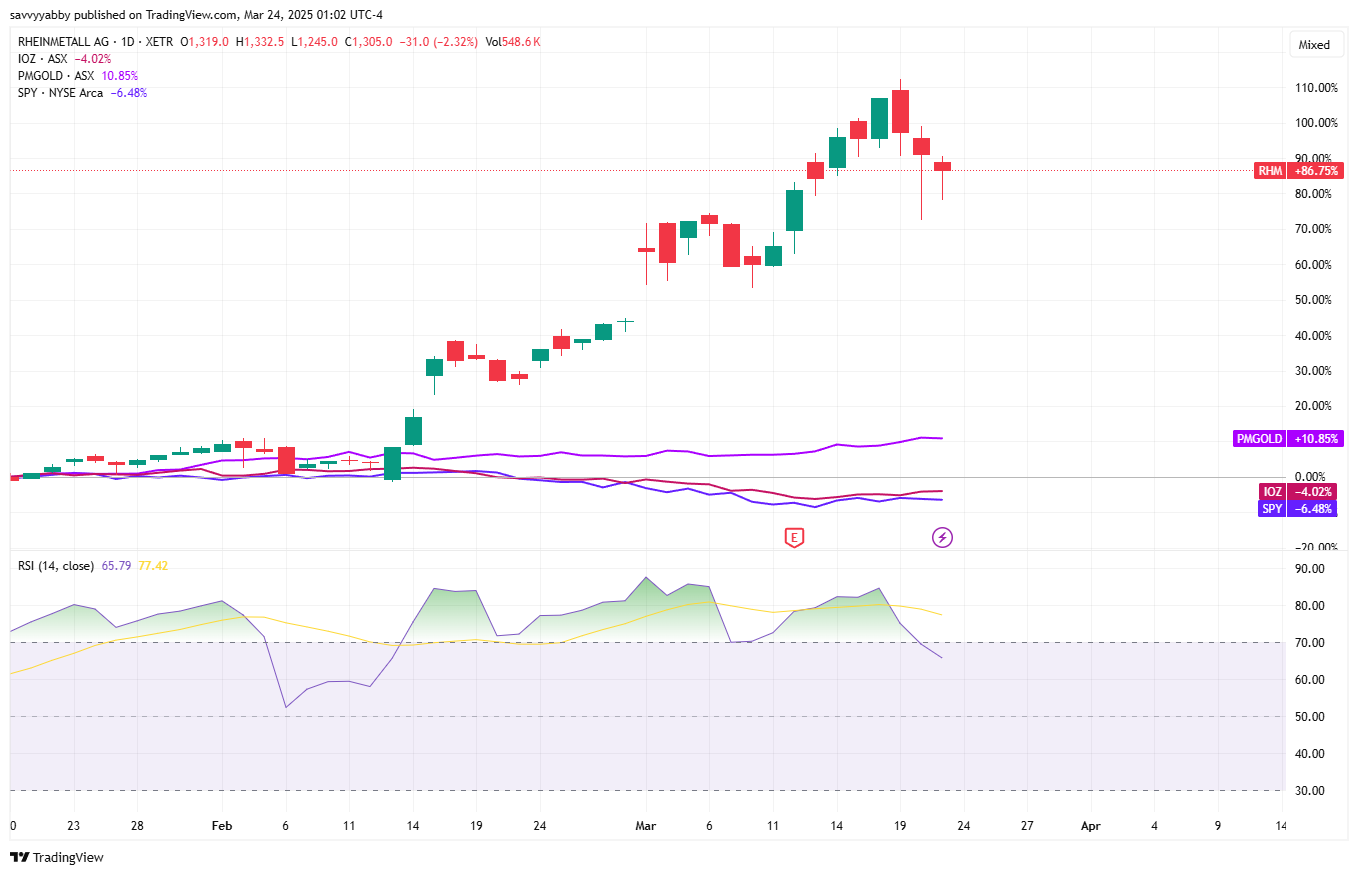
Following the European decision to up their defense spending, and to support the growth and deepening of the European defense industrial complex, this is a good place to also look for satellite exposures. The German armored vehicle and ammunition maker Rheinmetall XETR: RHM, is the leader in this charge.
The chart shows the S&P 500, ARCX: SPY (down -4.52%), Short-Term Bills XNAS: SHV, (flat 0.35%, excluding income), gold, ARCX: GLD (up 15.60%), European Financials, XNAS: EUFN (up 25.38%), and China tech XNAS: TCHI (up 14.98%).
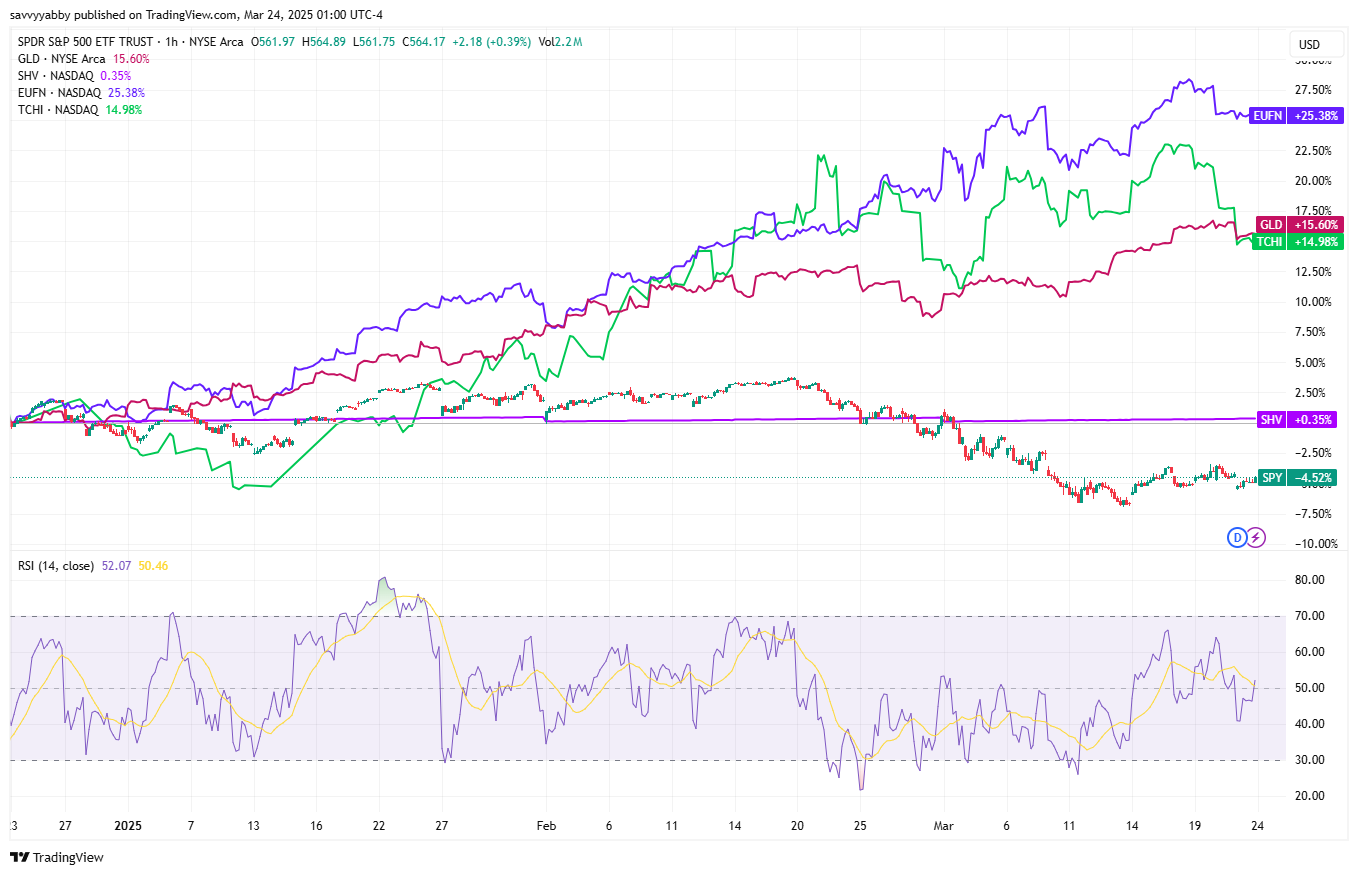
The US Treasury bills are pretty flat, as you would expect. You hold those as cash, since you can sell it on demand and the present running yield is about 3-4%. That will fall if the US Federal Reserve cuts rates, but the capital value is very stable.
China technology, gold and European Financials are all very different, but note that the performance is broadly similar, and divergent from the S&P 500.
This is because about 70% of global equity market wealth is tied up in US stocks.
Investors who have such a big chunk of wealth in once place have to sell that to buy something else if they are worried about US prospects. You can see that something else did pretty well, with our selections figuring prominently.
Evidently, it is probably now a good idea to take the 60% we allocated to the S&P Global 100 basket, via the single ETF IOO, and split some of that to satellites.
Conclusion
Our KISS portfolio consists of 40% the Australian S&P/ASX 200, via XASX: IOZ, and 60% the S&P Global 100, which is traded as XASX: IOO in Australia. For those who have a US brokerage account, the S&P Global 100 is XNAS: IOO on NASDAQ.
(now you see why I put those annoying ISOMIC exchange codes in there)
Supposing you can buy US listed ETFs, the simple starter is to sell some of this anticipated rally in US stocks, and by extension the IOO, and buy satellites.
There is no need to go crazy.
I think the maximum gold I would take now is 10%.
However, starting with zero I would buy 5%.
Given the foregoing discussion, I would bet that we are close to peak US market share in global equity capitalization. Therefore, I would buy satellites from the IOO basket.
If you took 5% in XNAS: EUFN and 5% in XNAS: TCHI you are down to 45% IOO, which is still a healthy chunk of the portfolio, with around 70% of that in the USA.
That is 40% Australia, 45% Global, 5% European financials, 5% China tech, 5% gold.
The coming two weeks ahead of the April introduction of broad tariffs by Trump likely offers the requisite “gap in traffic” to buy dips in recent non-US winners from selling into an anticipated recovery rally in US stocks, especially the liquid majors.
In the spirit of the 80s computer game classic, Frogger, where you had to guide your frog to safety across a busy two-way traffic stream, be patient and look for the gap.

The US market has had a full ten years of exceptional performance. Old habits die hard, and this is not a market to sell out of pique.
Keep holding leading US names but trim those on strength to rebalance some of your equity exposure into the previously neglected European and Asian markets.
Happy investing!