

International Twenty Stock Portfolio: Feb 2026 Global Power and Energy Transition
February continued our run of positive performance. The US 20 Model was up 1.87% while the S&P 500 was down -0.81% for a +2.69% Alpha. YTD our alpha is +4.68%

The Global Power and Energy Transition
Last week I updated our US Model Portfolio with the tagline:
Strategic Move to a Stagflation Barbell
Here I update the non-US International Portfolio with the tagline:
Global Power and Energy Transition
This may seem a little odd.
Why two different names for one unified strategic outlook?
The answer is that our view on stagflation risk in the West is motivated by what I view as the strategic response of the USA to the rise of multipolarity.
These are contentious topics, and there is no guarantee that my prognosis will prove correct in any detail, let alone all of them. However, as I explained in Hegel and Thematic Investing, I reason about market scenarios by identifying a dialectic.
Market Dialectic: Tension between Thesis and Antithesis.
This is a philosophical idea that I was led to co-opt for investment purposes.
The entire content of my investment philosophy is summarized in one idea:
The moment we identify two assets for investment contention we naturally have a pair of opposing tendencies: There is the thesis “A beats B”, and antithesis “B beats A”. There is both a narrative and a dialectic.
The moment I write:
USA = A
China = B
We can pose the Boss dialectic of our time:
Does the USA beat China or does China beat the USA?
Do you notice that this framing excludes the middle:
Neither China nor the USA beats the other.
This is the viewpoint that I subscribe to.
The binary narrative of the dialectic is what informs my strategy.
To the extent that Copilot may be considered reliable I posed this question:
What is the present global market weight in equities for the USA?
It responded with this table, which seems close enough for me.
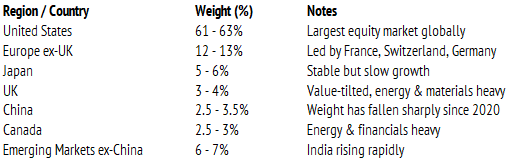
Notice that the LLM is smart enough to notice that China has fallen in market weight since 2020. There was a benchmark decision by MSCI and FTSE to use free-float market cap, not total market cap. This excludes state-owned enterprise.
I am not going to argue with this decision.
You can make up your own mind on which measure makes sense when thinking about the relative scale of equity markets. It is a horses for courses decision, in my view.
In the last Global Model Portfolio piece, you can see the weighting I have.
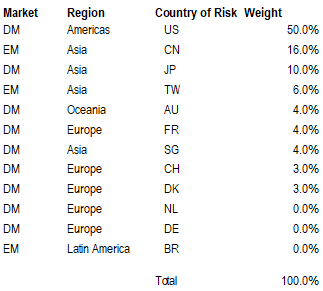
Notice that we own the USA at 50% weight, which is under the international level of most benchmarks. This is a reflection of relative value in relation to these themes:
Global mining - especially precious metals and copper
Global defense - with a focus on Europe, Japan and the USA
Global energy transition - with Hong Kong listed China technology the leader
Global artificial intelligence - with the USA and China equally represented
Global biotechnology - spread across Europe and the USA
Global finance - with banking in Asia and commodity markets in the USA
Global diversifiers - consumer stocks and some food conglomerate exposure
This is how I atomize the Global Power and Energy transition.
Formerly, I had not much oil and gas in the Energy transition basket.
That is because I saw oil and gas as being well-supplied globally. They are essential to keep the economy running in its present state, and any phase-out is a long project.
If you take China, it does not envisage becoming carbon-neutral until 2060.
In the contemporary politics of the USA, one might be forgiven for assuming that the idea of an energy transition is moot, and fossil fuels are here to stay.
I am not going to take sides in this debate on winners, other than to choose a relative weight of allocation. I am betting as much as 16% of portfolio on China, and that is a statement of recognition. China leads the renewable energy transition.
In the rebalance of this month, the primary changes I am making reflect adjustments to my thinking on the nature and pace of the global power transition.
There are two forms of power that dominate discussion in geopolitics:
The dialectic of power balance distinguishes soft versus hard power.
Until recently, the common view is that China lacked for both forms of power. The USA weas considered to be strongest in both hard and soft power.
It is early days, but I think this assessment is in global flux.
The change has been very apparent since the re-election of President Donald Trump. The tariff actions, use of sanctions, military power, and convening efforts like the new Board of Peace, the Shield of the Americas, and the Minerals Security Partnership, are signifiers of the strategic competition between the USA and China.
This is the sharp end of the global power transition.
Can the USA recover its former position as the sole global hegemon?
I do not think so, but I must reflect the possibility in portfolio choices.
In relation to our stated themes, I see a bifurcation between the West and non-West.
The West has the power to lose and looks set to reinforce the status quo.
The non-West has the power to gain and is betting heavily on the new.
Notice that this dichotomy is not clear cut. The West has plenty of innovative capacity but seems to be tilting that to military aims and the defense of traditional markets.
The non-West is showing great dynamism in the adoption of new ideas.
If you are skeptical, check out Brazilian digital bank Nu Holdings XNYS: NU.
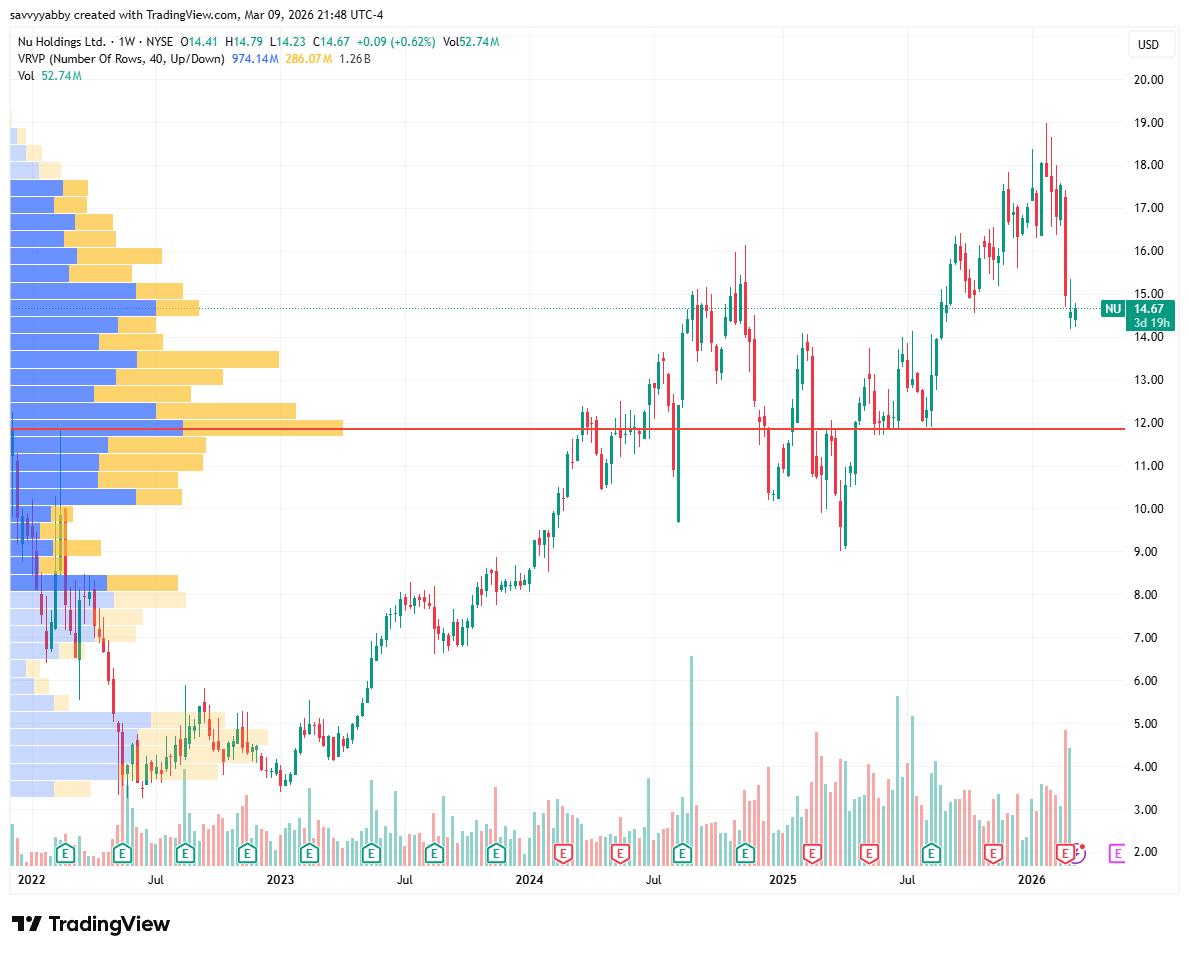
We used to think of Brazil as a mining market, but the financials are now larger.
Notice that non-resources comprise 71.17% of the Brazilian market ARCA: EWZ.
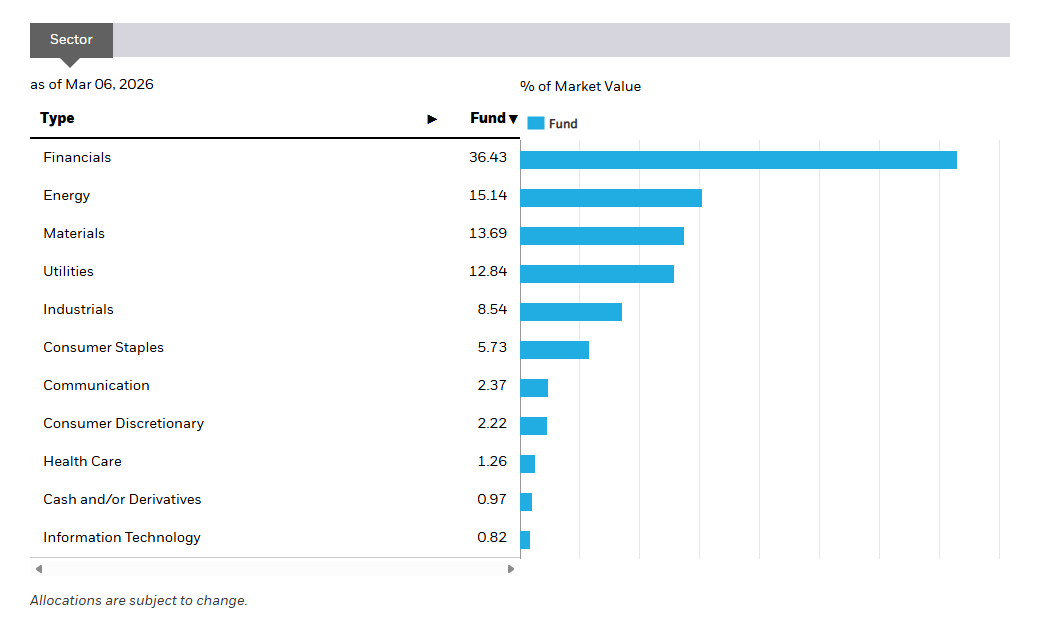
In Australia, ARCA: EWA, the proportion of non-resources firms is 73.27%. Notice that Brazil is more heavily weighted to consumer defensives, like staples, and utilities.
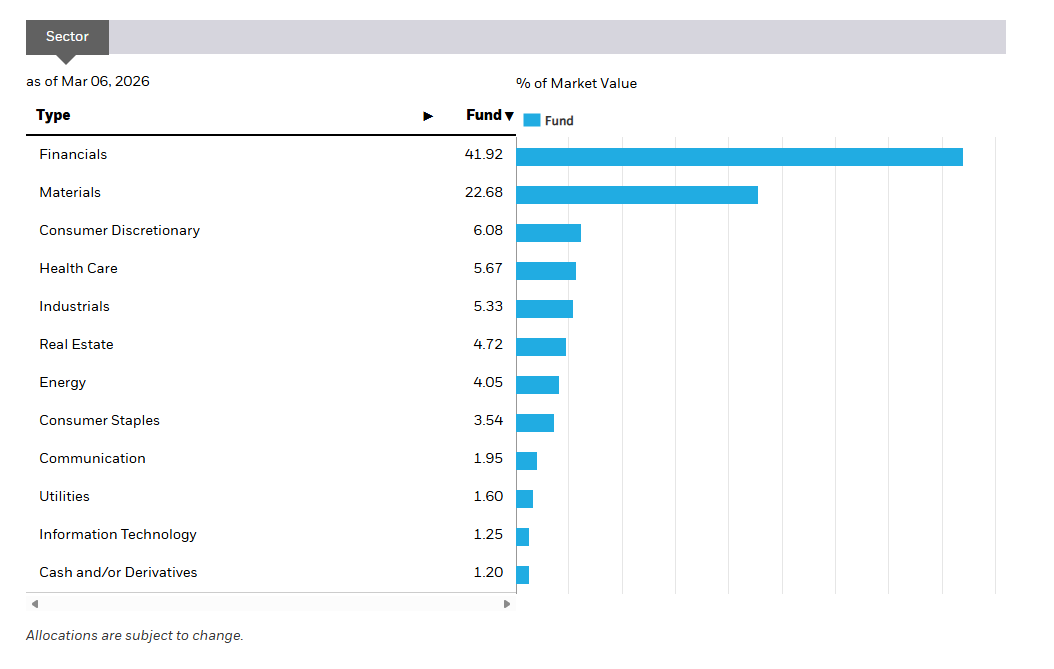
If we look at another resource-rich emerging market, like South Africa ARCA: EZA, we can see a similar pattern to Australia and Brazil.
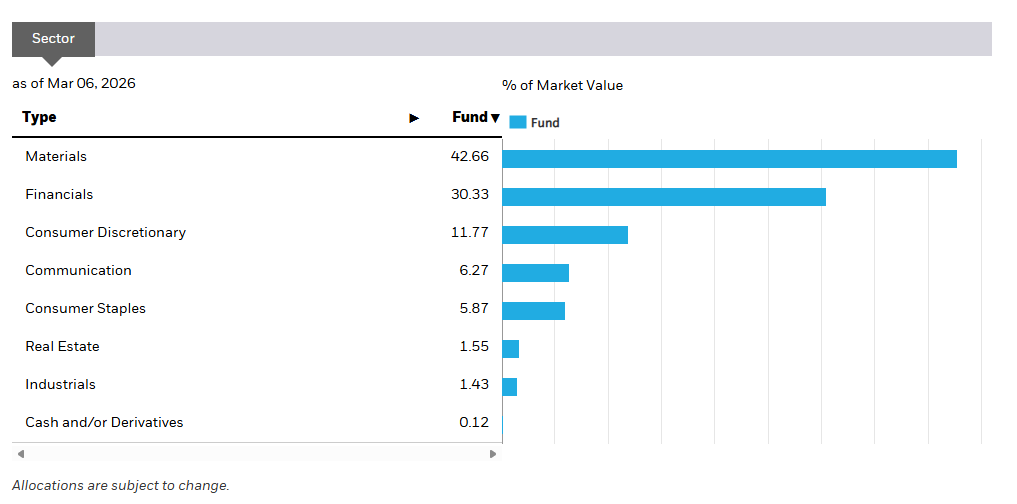
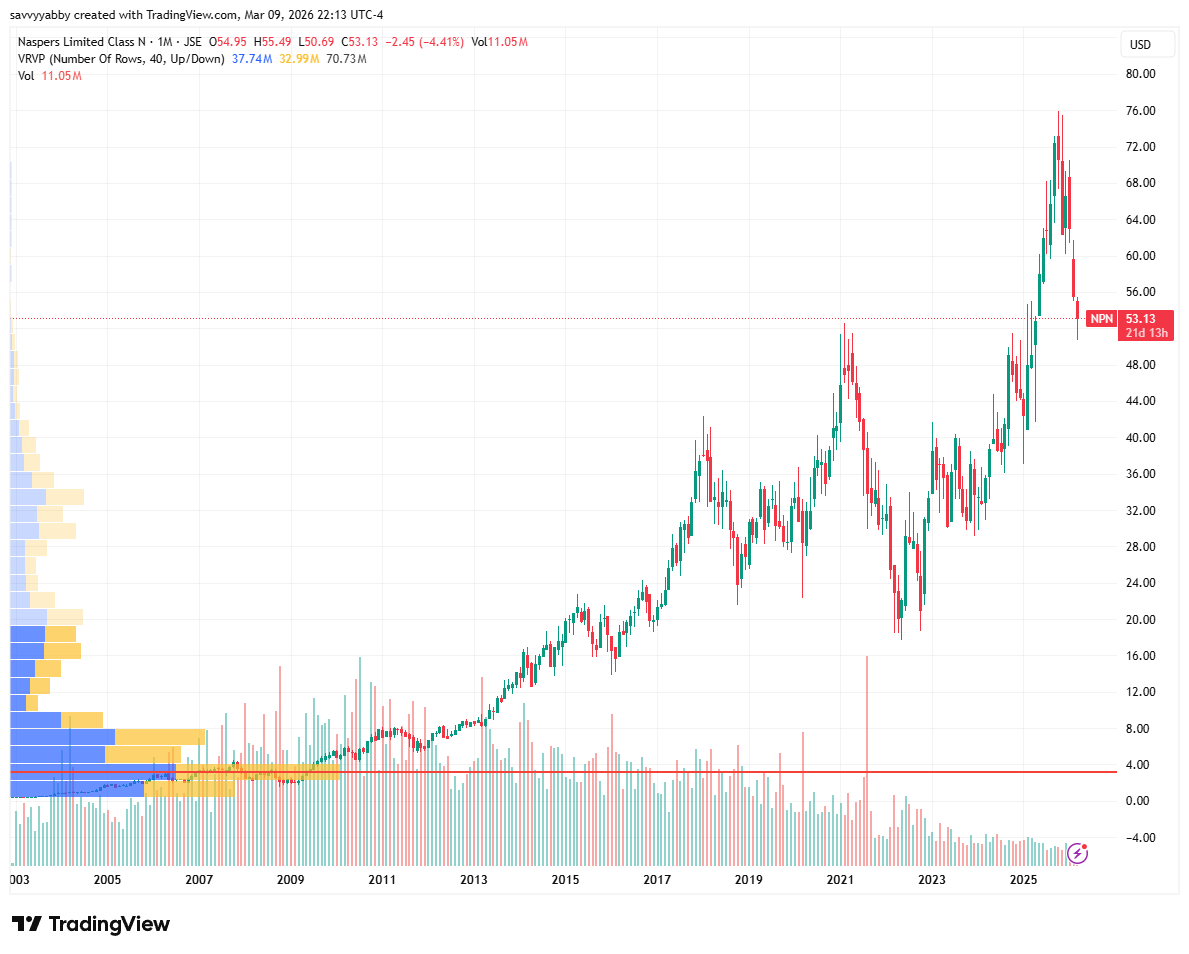
Gold and Platinum miners comprise 40.97% of the South African equity market. The other point to notice is that consumer discretionary is 11.77% of market. There is a dominant player called Naspers XJSE: NSP, which is a digital e-commerce group.
Naspers is the third largest company in South Africa, and returns have been good.
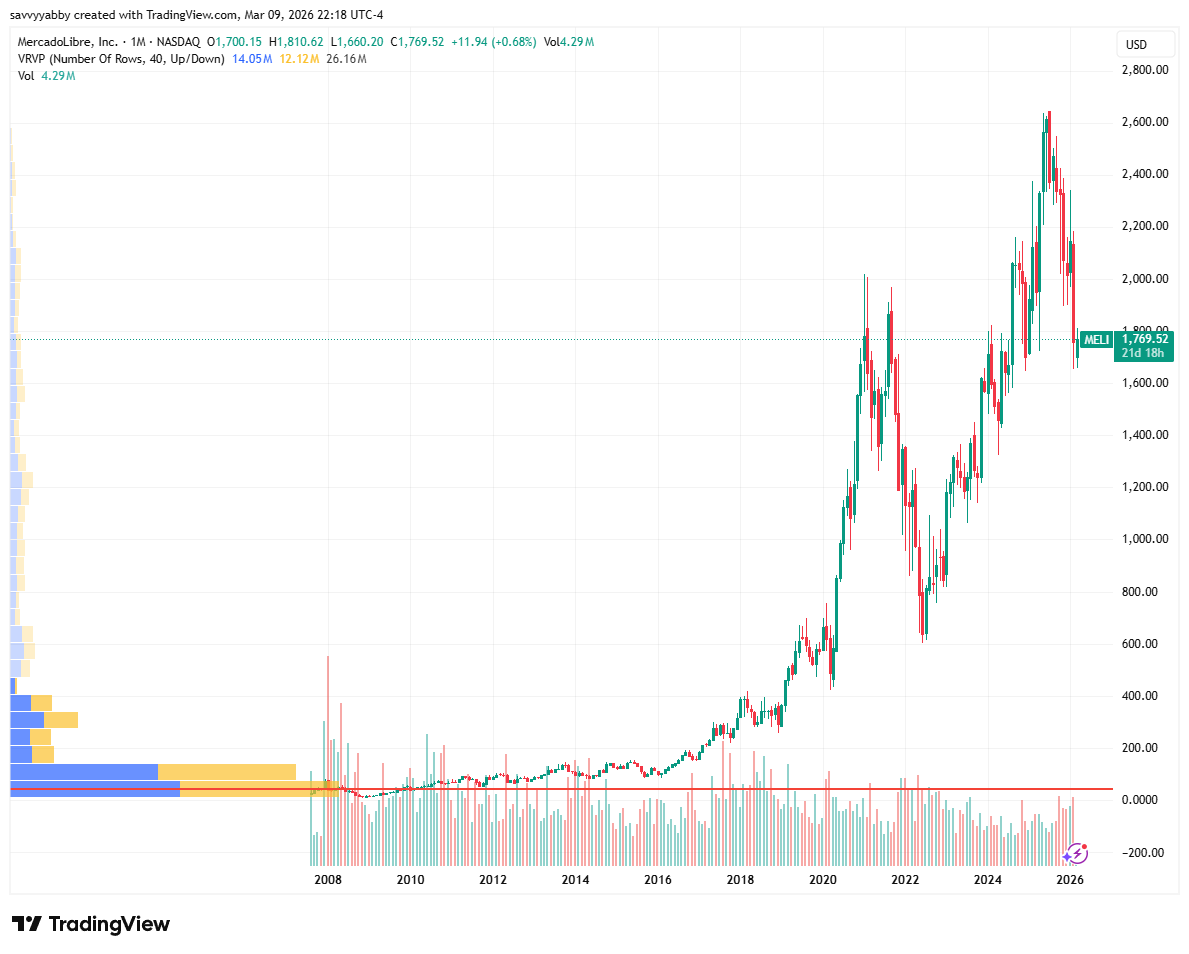
The same is true of Buenos Aires, Argentina based Mercado Libre XNAS: MELI.
The purpose of this brief excursion into global markets is tell a story that is not often heard in the Western media. Contemporary Emerging Markets are modern.
Look at the MSCI Emerging Markets ARCA: EEM ETF sector breakdown.
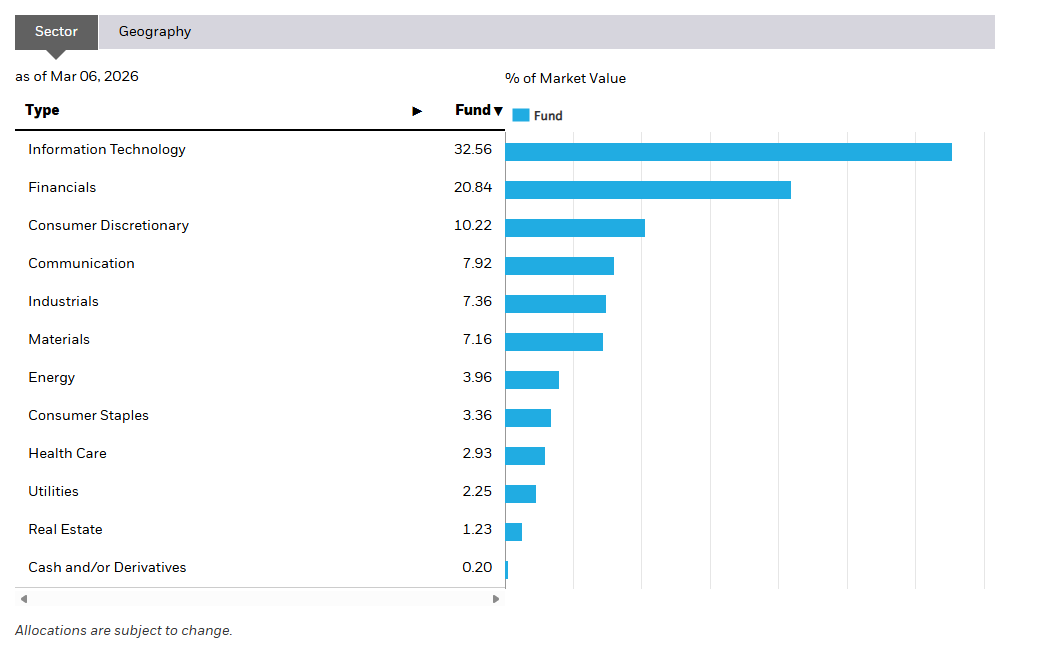
In comparison, the US S&P 500 ETF ARCA: IVV is only marginally higher.
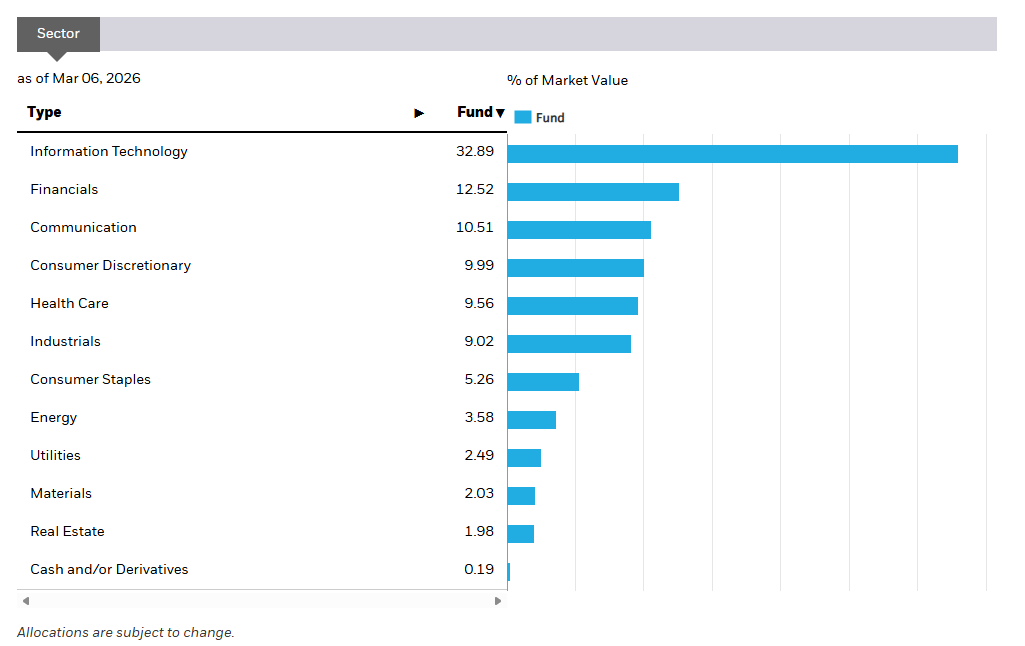
There are a few caveats with the last statement, as some US technology giants, such as Amazon XNAS: AMZN are classified under consumer discretionary, while search and advertising giant Alphabet Inc XNAS: GOOG is under communication.
However, notice that Australia is 1.25% Information Technology versus the 32.56% in that sector within the MSCI Emerging Markets. Some might contend that, really this picture is distorted by the large weighting to Taiwan Semiconductor XNYS: TSM, the presence of Samsung Electronics XKRX: 005930, Tencent XHKG: 0700 and Alibaba Group XHKG: 9988. How so? These are real companies, just like BHP or RIO.
The point to be made is that the non-West is rising.
I do not think that can be stopped.
Nor should it.
Model Portfolio Offering
The Savvy Yabby Report distributes our institutional grade model portfolios to paying subscribers on a monthly basis. The current list includes these strategies.
Australian 20 Stock Model Portfolio
USA 20 Stock Model Portfolio
International (non-USA) 20 Stock Model Portfolio
Global Best Ideas 25 Stock Model Portfolio
The existing research notes and newsletter offer remains, but you will see some tighter integration between what we write there and the model portfolios.
Regulatory Disclosures
This service is owned and operated by Jevons Global Pty Ltd.
The licensing and complaints procedure is outlined in our Financial Services Guide.
For legal reasons, I need to include this informational disclosure.
These portfolios follow the Jevons Global investment process.
The last change to the model portfolio was effective at close 30-Jan-2026.
These were described in the note International Twenty Stock Portfolio: Jan 2026.
NB: Past performance is no guide to future results.
Model portfolios are not audited and are only approximate guides to real results.
Performance Summary for Feb-2026
The month of February was marred by a poor showing following the result for major holding Novo Nordisk XNAS: NVO. This dragged us down to a -1.17% return behind the benchmark FSTE Global All-Cap Index, or Vanguard ARCA: VT, up 1.64%. This resulted in a negative alpha of -2.81%. The one-year alpha slipped to -1.42%.
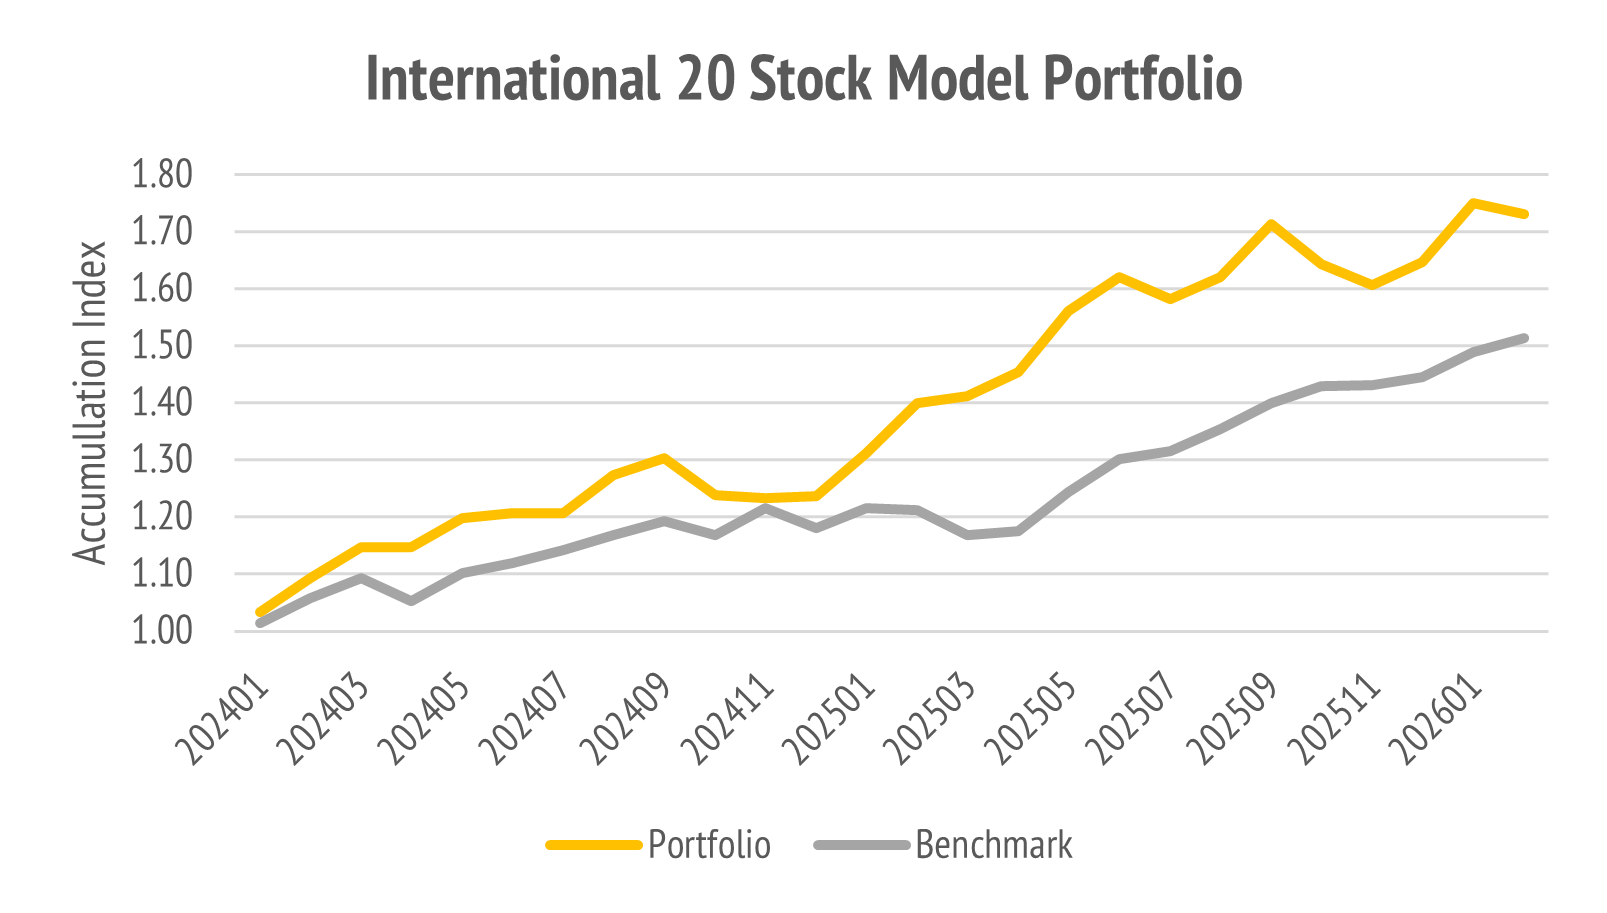
Overall, the model performance since inception has remained positive.
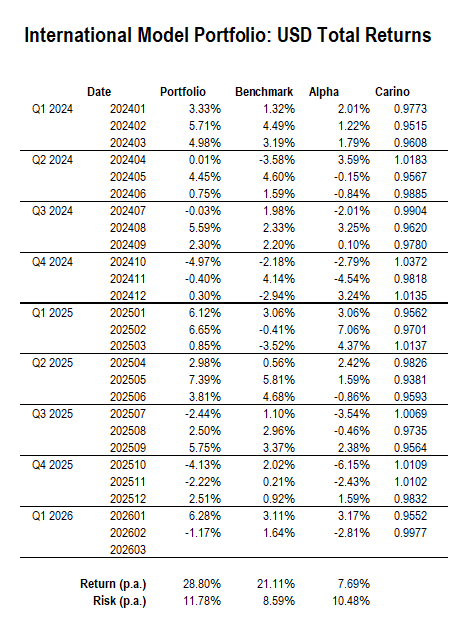
The negative month dragged us down from an otherwise good start.
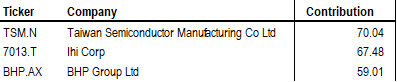
Key Contributors
The top three positive contributors to performance in Feb-2026 were:
The top three negative contributors to performance in Feb-2026 were:
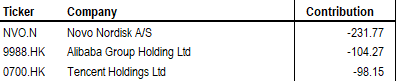
The correction to technology stocks in Hong Kong and a negative outlook for Novo Nordisk were the main drivers of this pull back. Novo Nordisk had reported good earnings results on 4-Feb-26 but was hit by US actions on drug pricing.
Our timing of the lift in weighting on 30-Jan-26 proved premature. The impact of the correction has taken the portfolio weighting back to 3.83%. We will wait on this one.
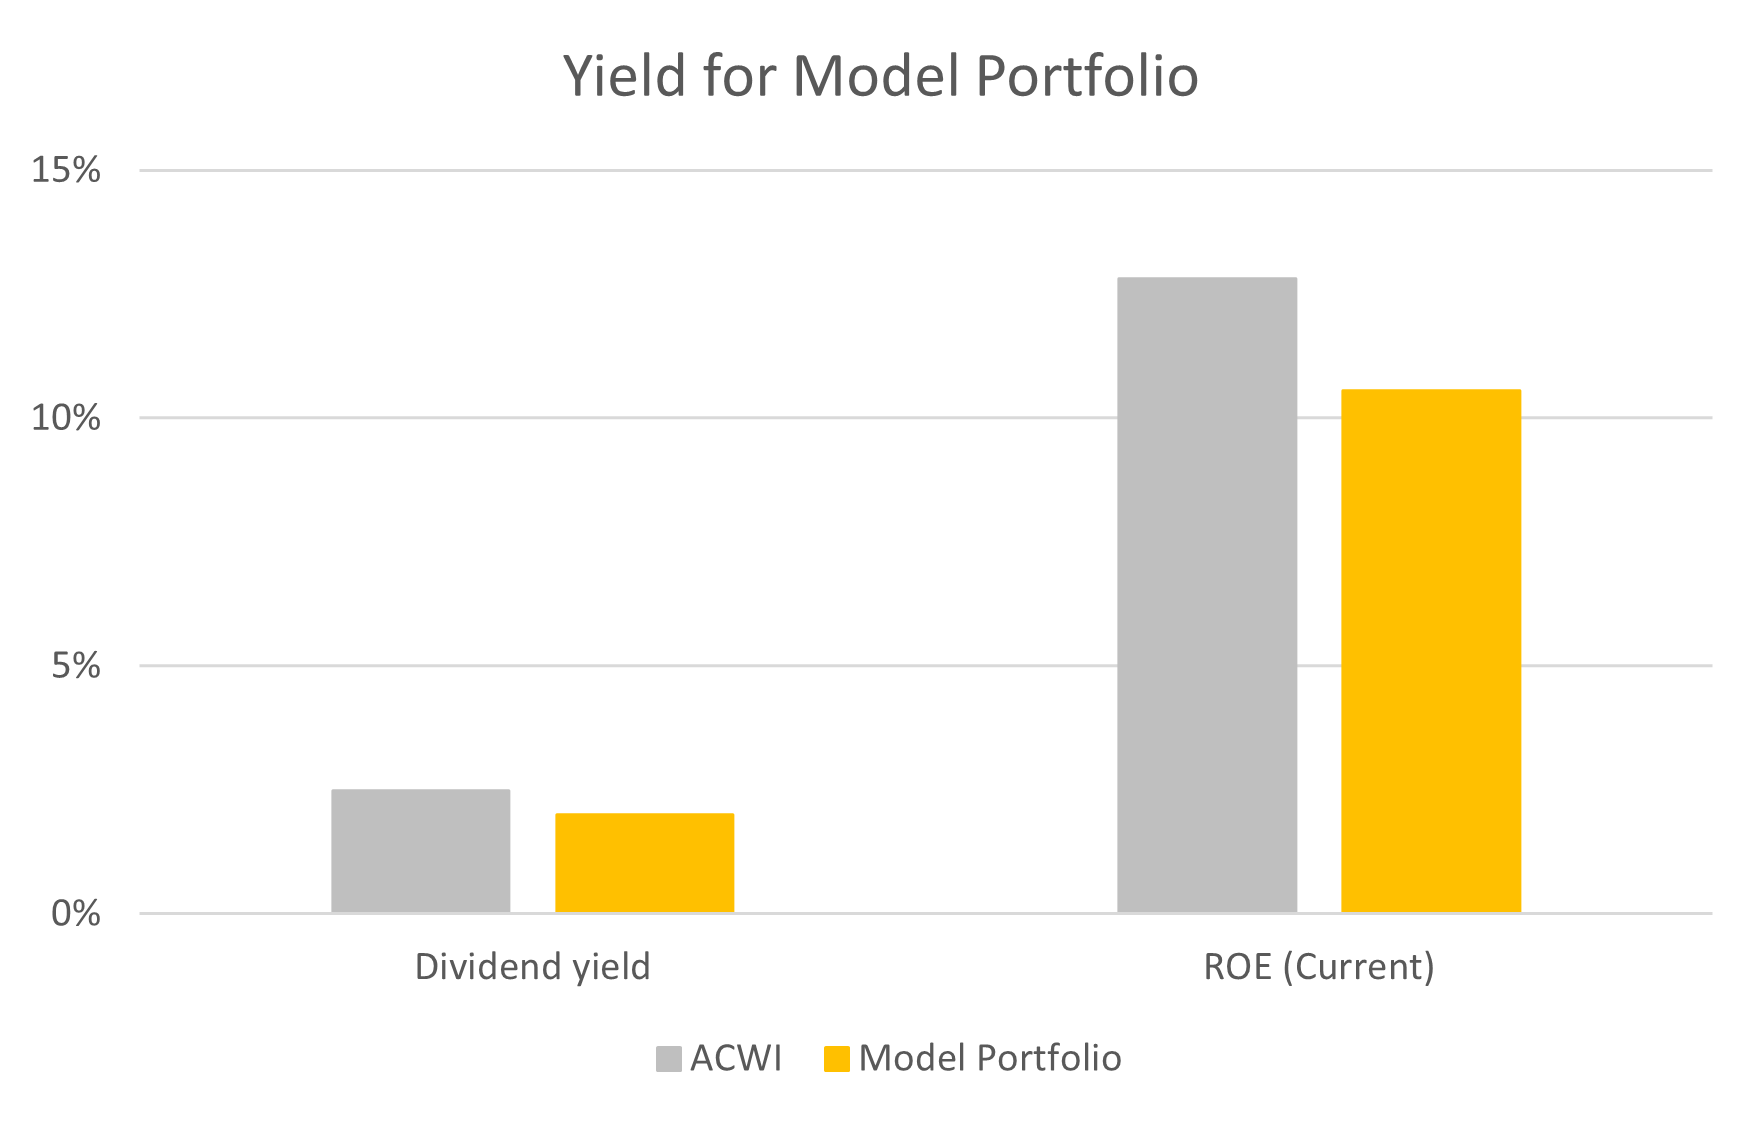
Portfolio Valuation Metrics
The portfolio valuation is above market on trailing earnings and inline on forward.
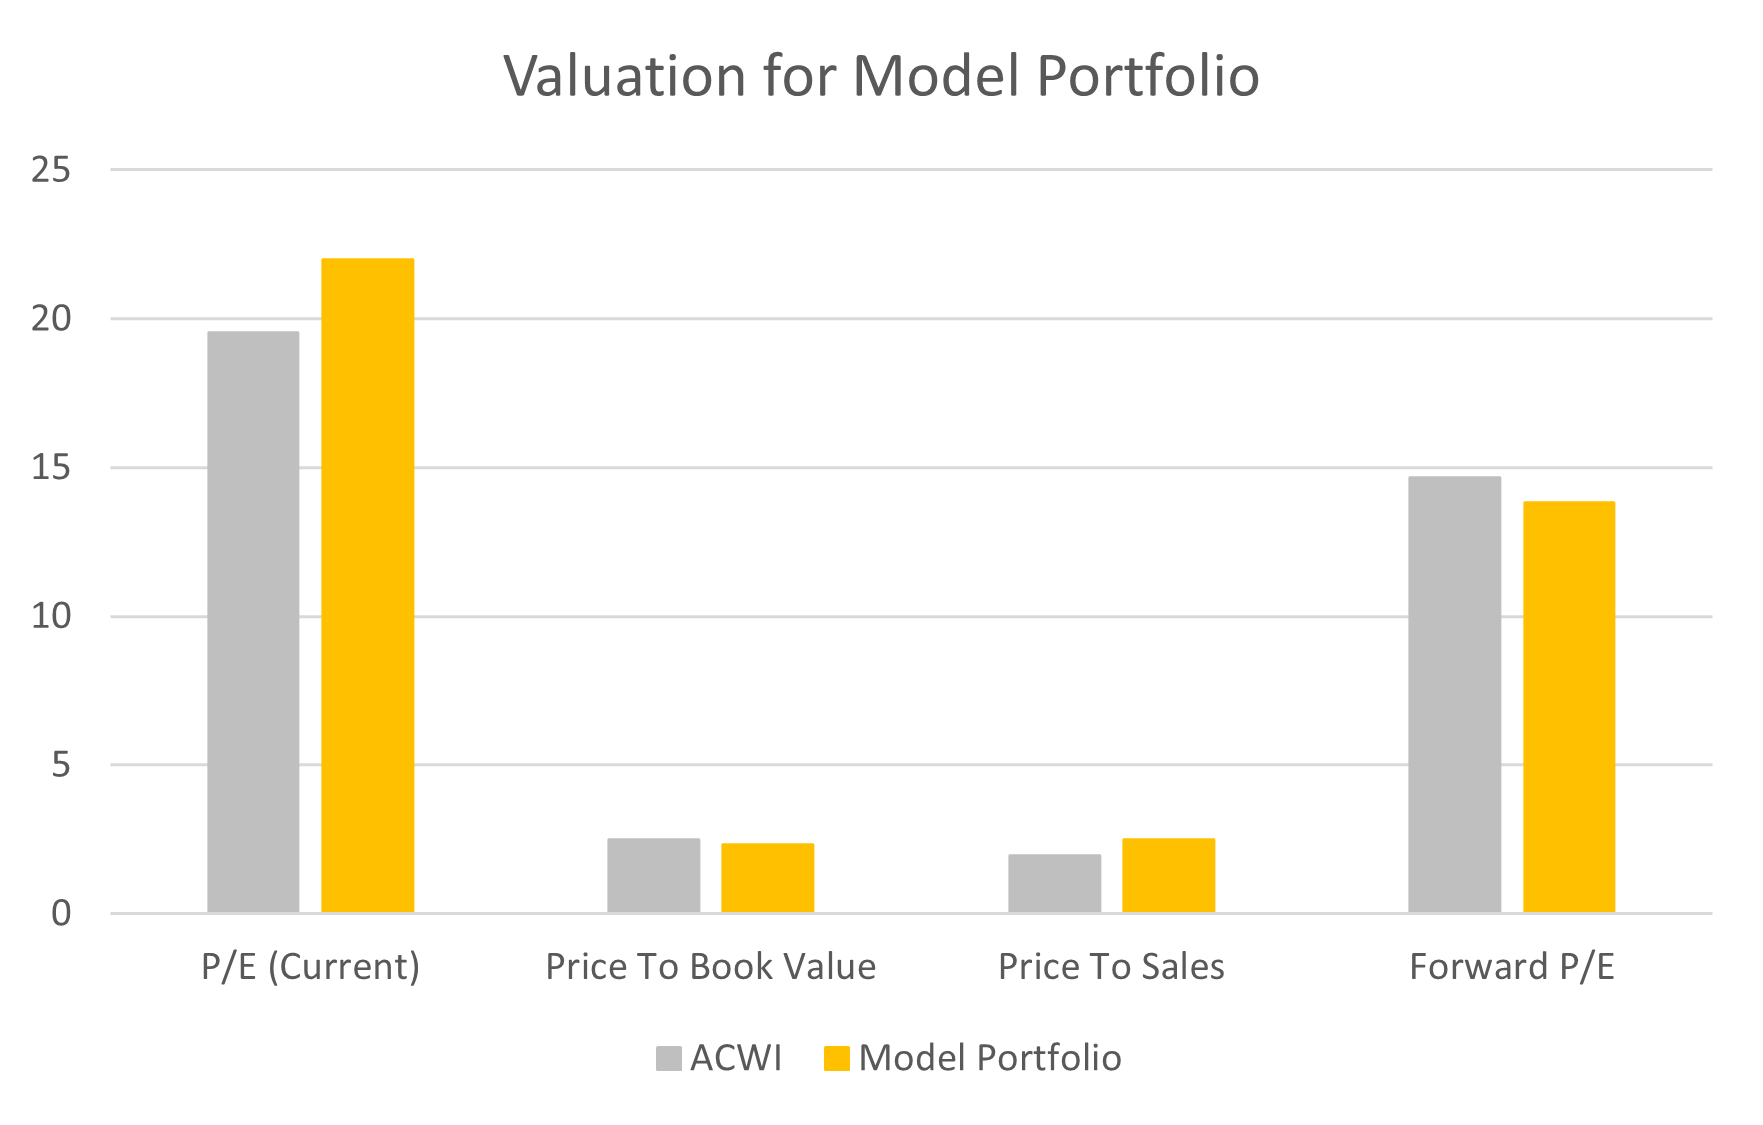
The dividend yield and Return on Equity (ROE) is below market.
The portfolio is underweight resources, and financials, neutral digital technology, and is overweight industrials, via analog technology and healthcare via consumer needs.
There are no portfolio changes for the international portfolio this month.
The current portfolio weights are shown below.
