

Global Model Portfolios
To complete our Model Portfolio lineup, we update the International 20 Stock Model and the Global 25 Stock Model to complement the Australian and US 20 Stock Models.

This month we completed rebuilding our performance and portfolio construction systems to run on new data sources to maintain our model portfolio system.
We now complete the offering announced in Australian Twenty Stock Portfolio.
The service levels and range are now expanded to include:
Australian 20 Stock Model Portfolio
USA 20 Stock Model Portfolio
International (non-USA) 20 Stock Model Portfolio
Global Best Ideas 25 Stock Model Portfolio
The existing research notes and newsletter offer remains, but you will see some tighter integration between what we write there and the model portfolios.
This commenced with the USA 20 Stock Model Portfolio.
Today we add the ex-USA 20 Stock International model and the best ideas Global 25.
Going forward, I aim to synchronize the reporting on these to month-end.
Today is the last trading day of January 2025.
The performance reports for all four models will appear in one omnibus report that comes out after the month end, ideally within a few business days, time permitting.
Rebalance activity could happen in the middle of the month and will increasingly be tied to our research notes. Portfolio management is like a funnel that takes ideas to actions in a deliberative process. In my way of investing, this always starts with a background big picture view of global markets and global investment themes.
The Global Big Picture
The main focus of this newsletter is the equity market. This means stocks not bonds, real estate, commodities, and other alternatives. I approach this from the standpoint that asset allocation is really your business, because only you know your needs.
Within the limitations of general advice, which does not take account of your personal circumstances, risk appetite, income requirements, time of life, or employment status, our focus is on fully invested portfolios.
This means I am just providing a model portfolio that is 100% in equities.
This should be supplemented with cash and other holdings to your needs.
I will write about the principles involved but not the specifics.
For example, in the note Going global with ETF product, I explained some simple ways to build a global equity exposure using inexpensive ASX-listed ETF products.
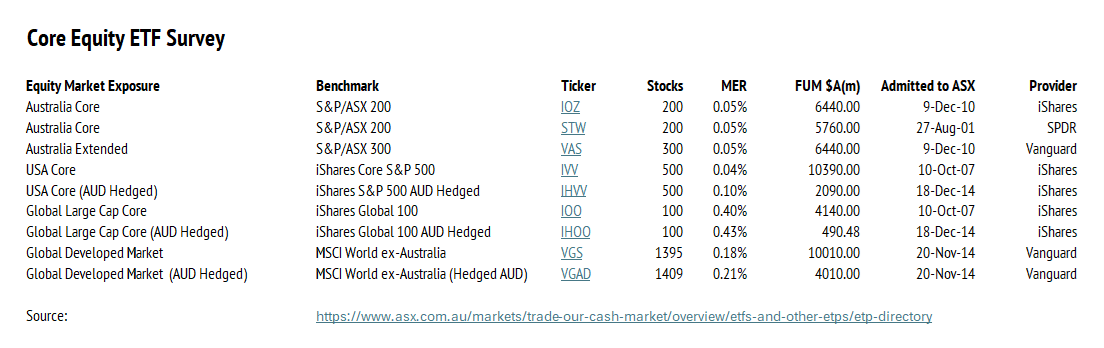
You can easily build a well-performing passive investment to complement individual stock holdings on the Australian Stock Exchange using these vehicles.
For those who are concerned about foreign exchange fluctuations you can even buy hedged investments, which purposefully take out the moving exchange rate. This is really a personal choice, since the risk-return behavior is not clear cut.
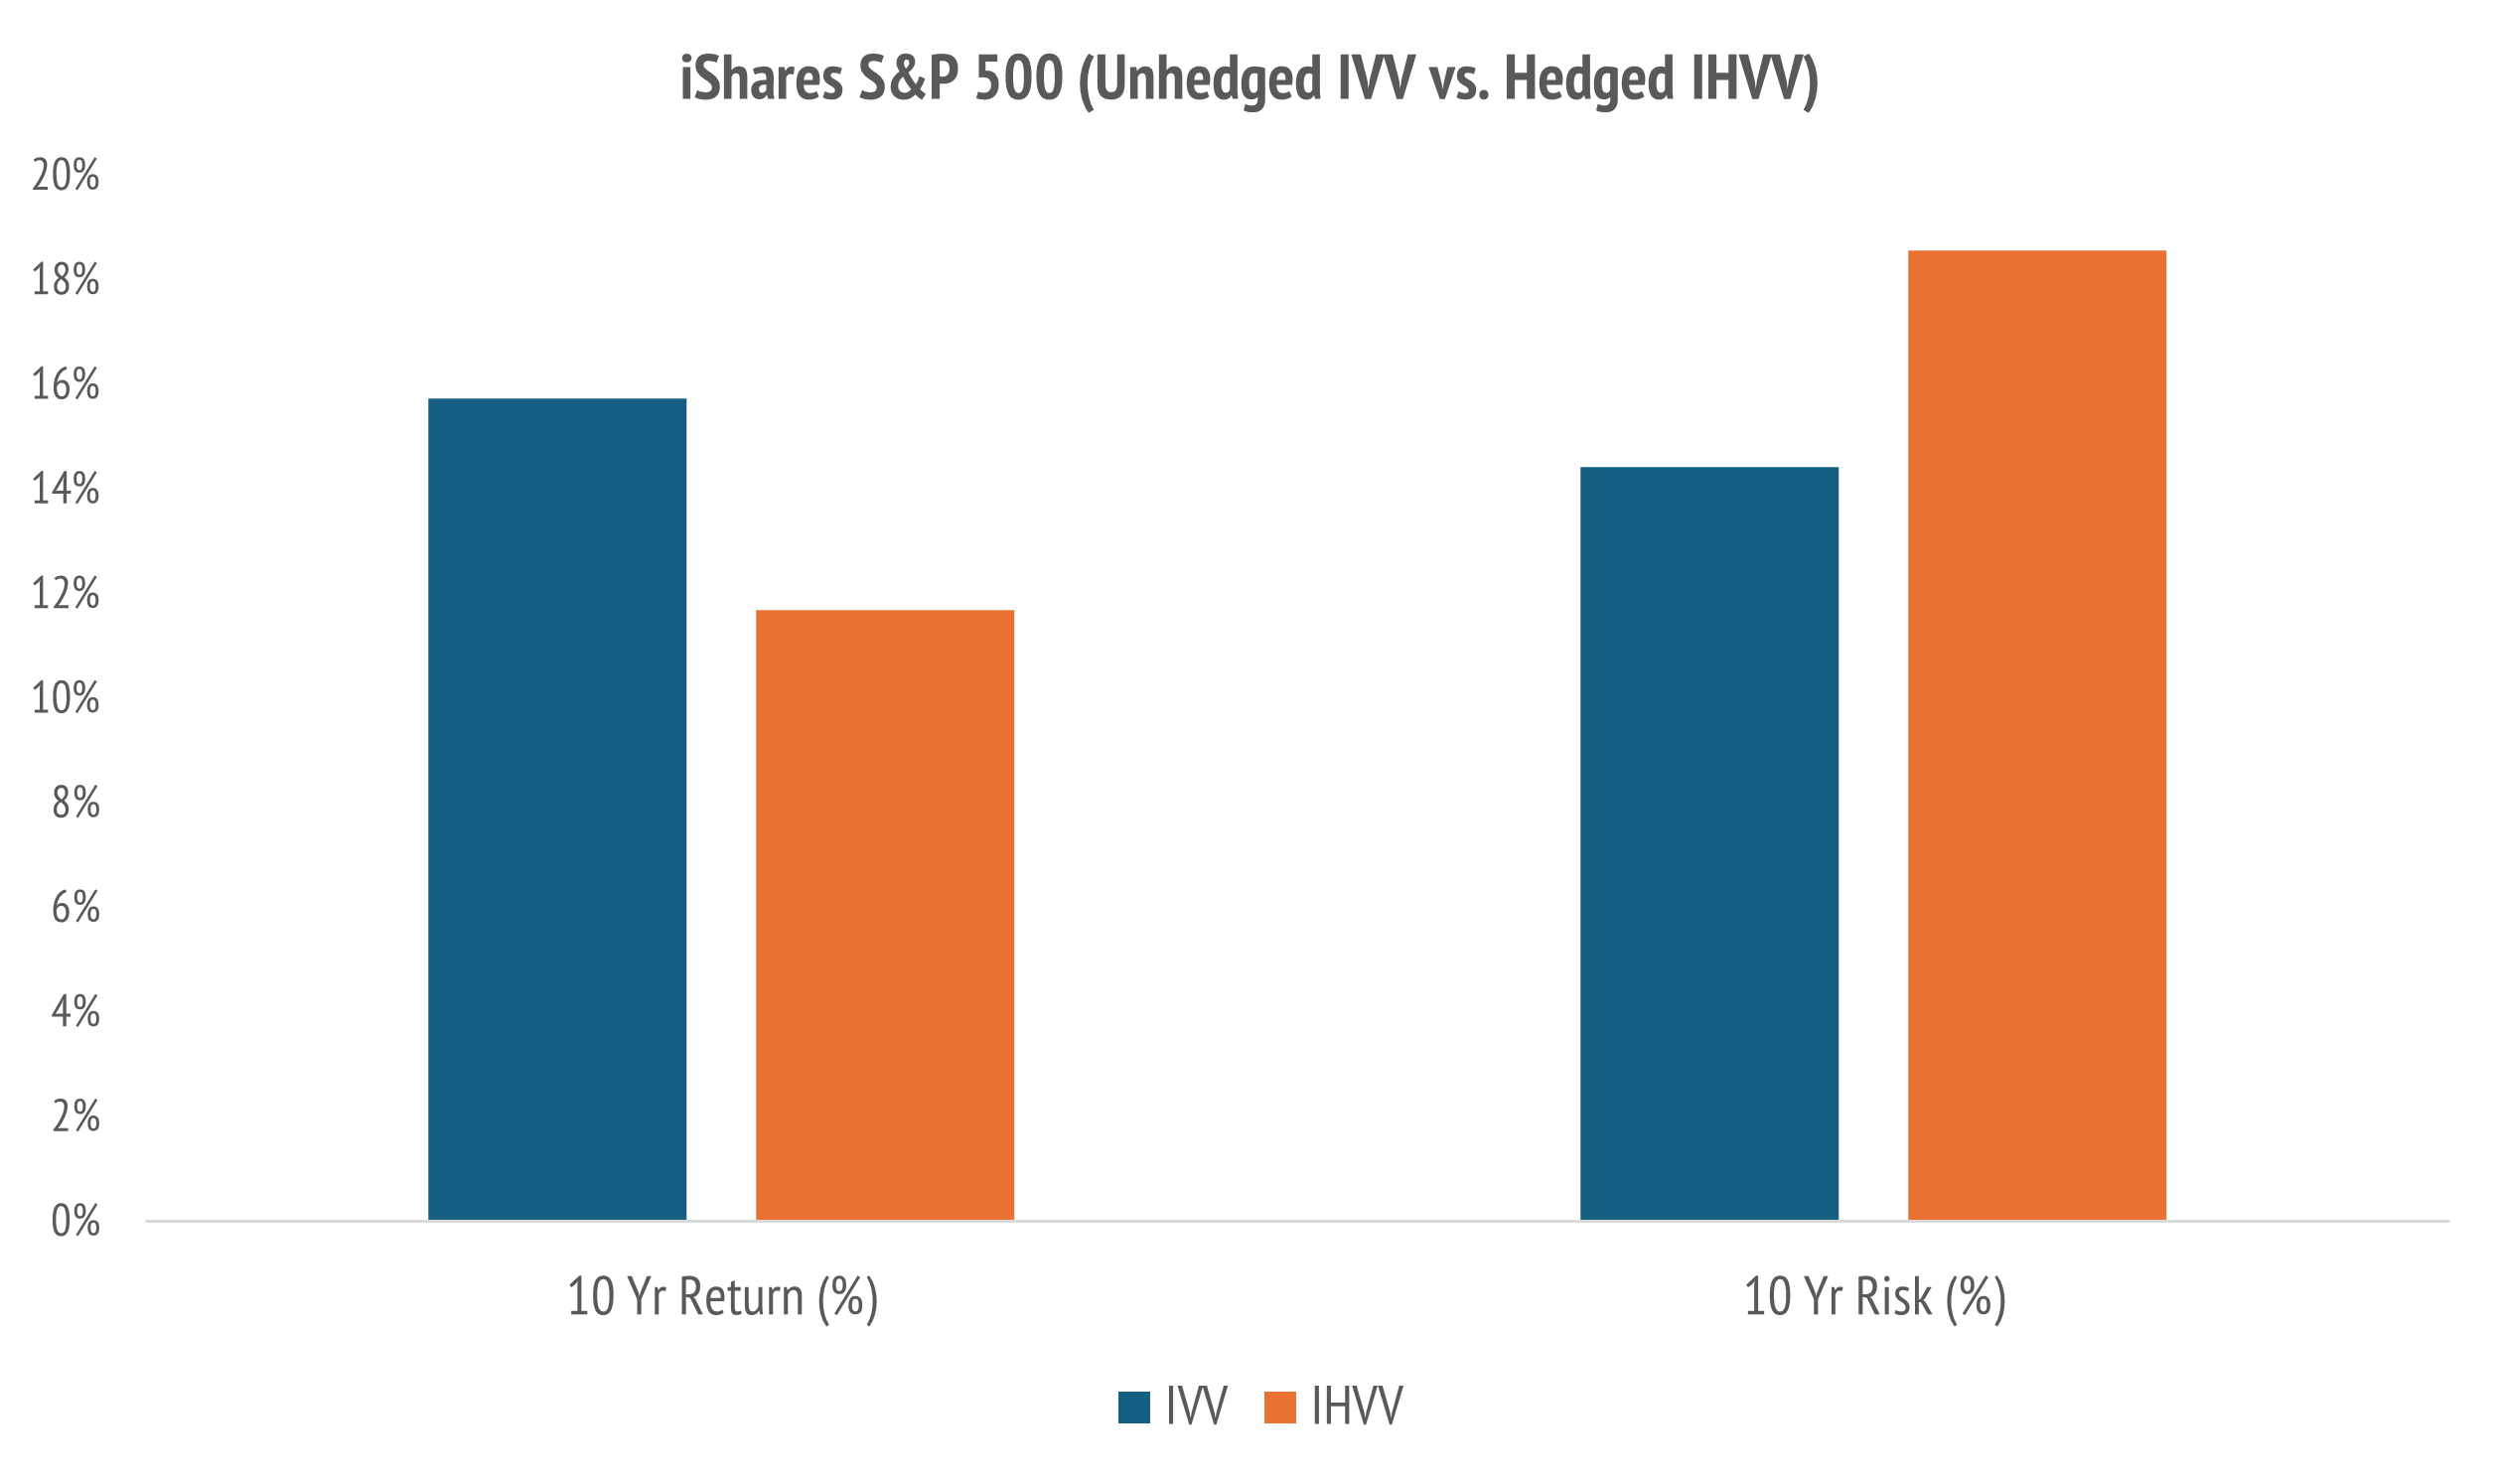
While I have written on these subjects, and will again, the philosophy of this investor is to keep things simple, and to treat unhedged, fully invested, global equities.
In my way of thinking, I can always raise cash in a target currency if I fear adverse moves in one currency block. There is a lot that can be achieved this way.
I explained this in Unboxing our KISS portfolio: IOZ+IOO, using a 40% ASX S&P 200 plus 60% S&P Global 100 portfolio. The general principle at work is that putting some capital to work in global equity markets can produce higher returns at lower risk.
These statements always come with the caveat that the past is no guide to the future and that anything could happen, including disruptive world leaders.
This is the Keep it Simple Stupid (KISS) principle.
Get the big picture right and the rest will follow.
The big picture is the Australian stock market is only about 2% of the World market value, while the USA is close to 70% of total equity market value.
The other thing to remember is that the USA is the most successful economy today, but the world is a big place, and the folks in other countries have aspirations too.
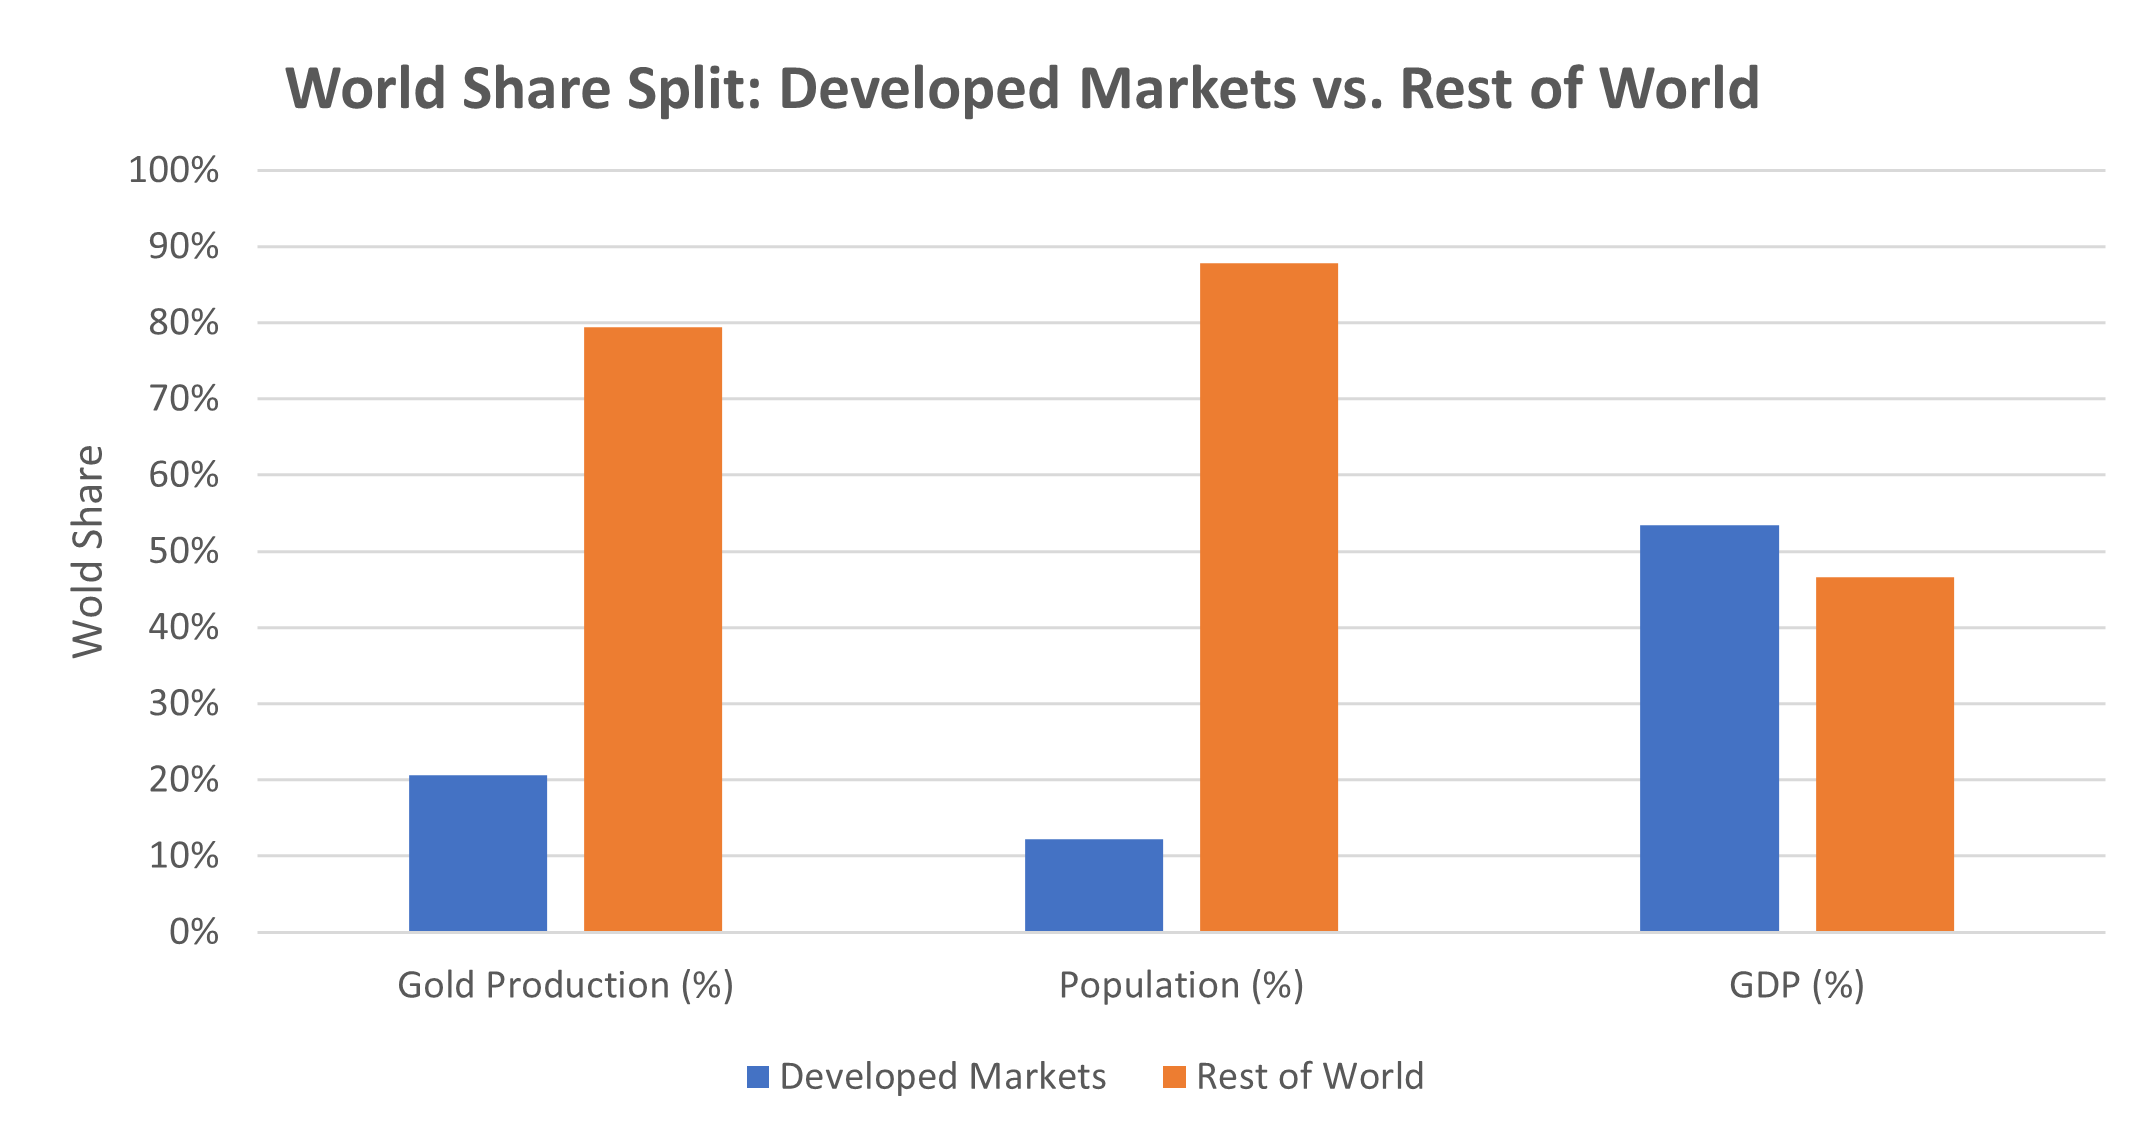
There is period in history where the Western Developed Markets have done very well but the way you slice the global economy matters to the investment theme. A great example of this is global gold production. It is a non-Western story.
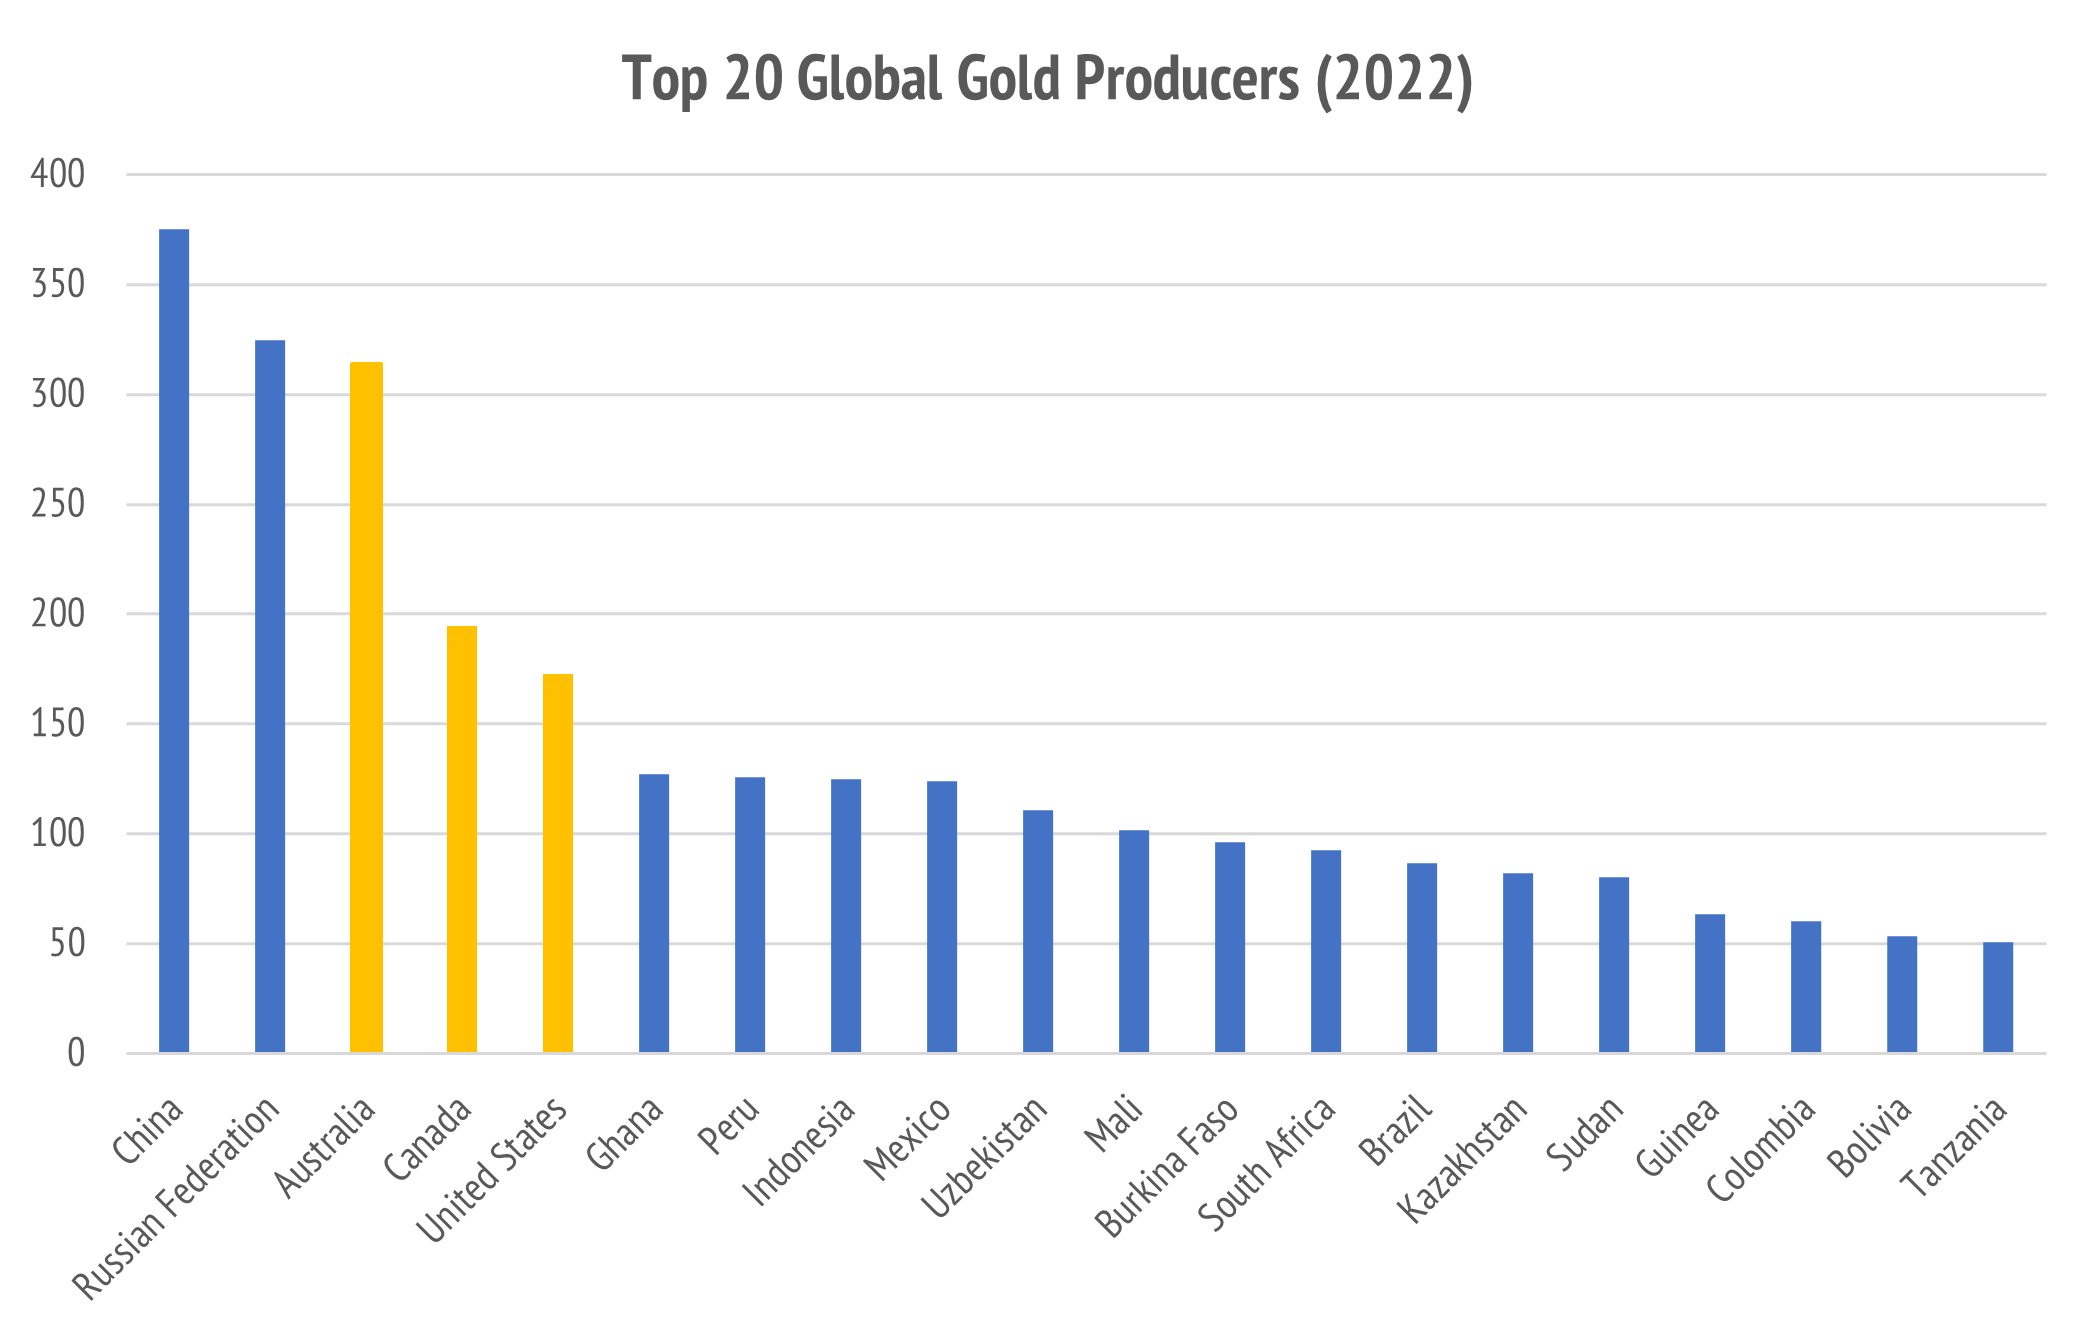
The ASX is a great place to invest in gold miners: Best Global Idea: ASX Gold Stocks. The purpose of research is to help figure this out. Hong Kong is great for EVs.
In The Nine Dragons of Kowloon, I shared some ideas on how to make up a diversified global equity exposure using Hong Kong listed H-Shares.
This was a purposefully underweight US strategy that sought to own about 40% in US stocks and 60% in non-US stocks according to this rough allocation:
Australia 15%
Europe 15%
Japan 10%
China 10%
Other 10%
The China allocation I nominated was Hong Kong listed H-Shares.
Perhaps you can see an emerging pattern of thinking already. Construct global mining exposure in Australia, and energy transition exposure in Hong Kong.
This style of investing was elaborated in The Global Investment Themescape.
Our primary active theme now is the commodity bull market, as we explored in The Precious Metals Bull Market, and our recent Commodity Outlook 2026. Other themes of importance are Artificial Intelligence and Defense Spending.
The value of the model portfolio discipline is that we have to squeeze such ideas into an actionable investment strategy that remains well diversified and balance.
That is my central mission in this newsletter: to make it all doable.
The rubber hits the road when it is all pulled together into a portfolio.
Our Flagship Portfolios
I will discuss the Australian Twenty Stock Portfolio separately because it plays the role of an Australian only diversified core equity portfolio. Thematic investing is very limited in a single country setting because some industries just are not there.
This is different in the global context, so we have three strategies.
Each of these has the same inception date, 18-Jan-2024, so they have been running in the background, while this blog was set up, for a full two years now.
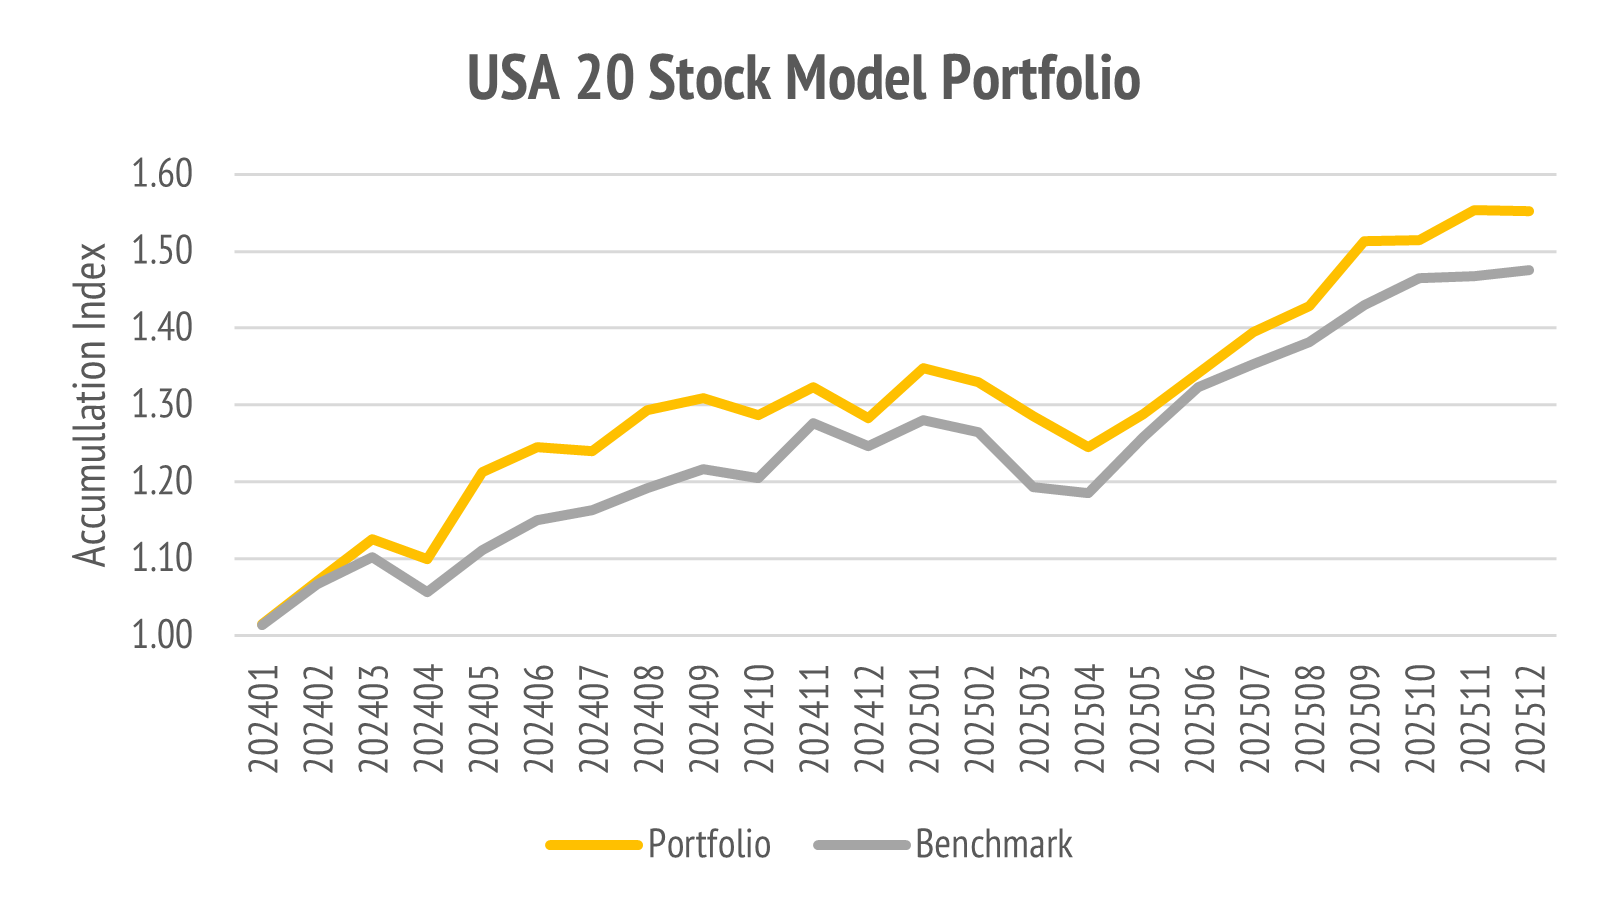
The US 20 Portfolio
This is a concentrated equity portfolio benchmarked to the US S&P 500, which is the primary large capitalization US equity benchmark, which is the IVV ETF.
The latest portfolio update was our note: USA 20 Stock Model Portfolio.
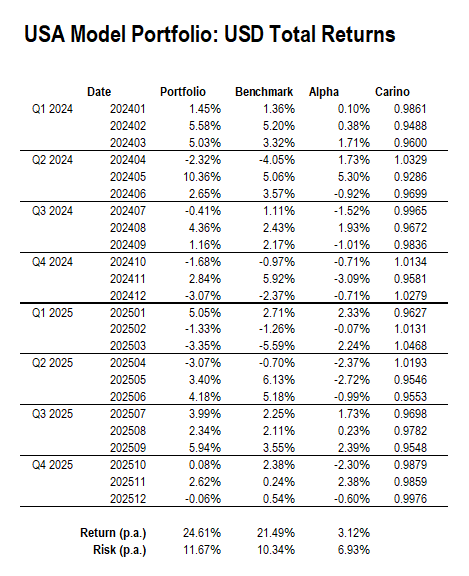
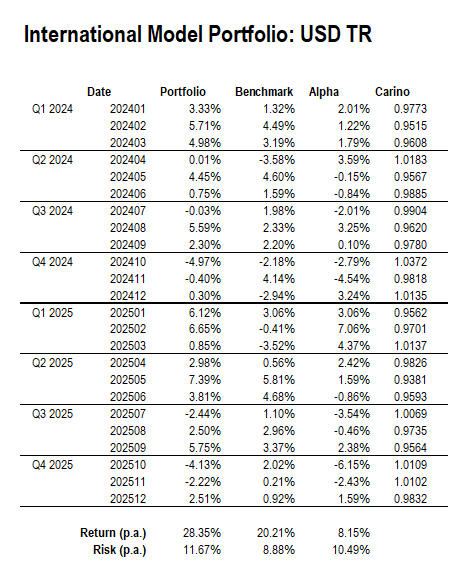
The performance is measured in USD, on a total return basis.
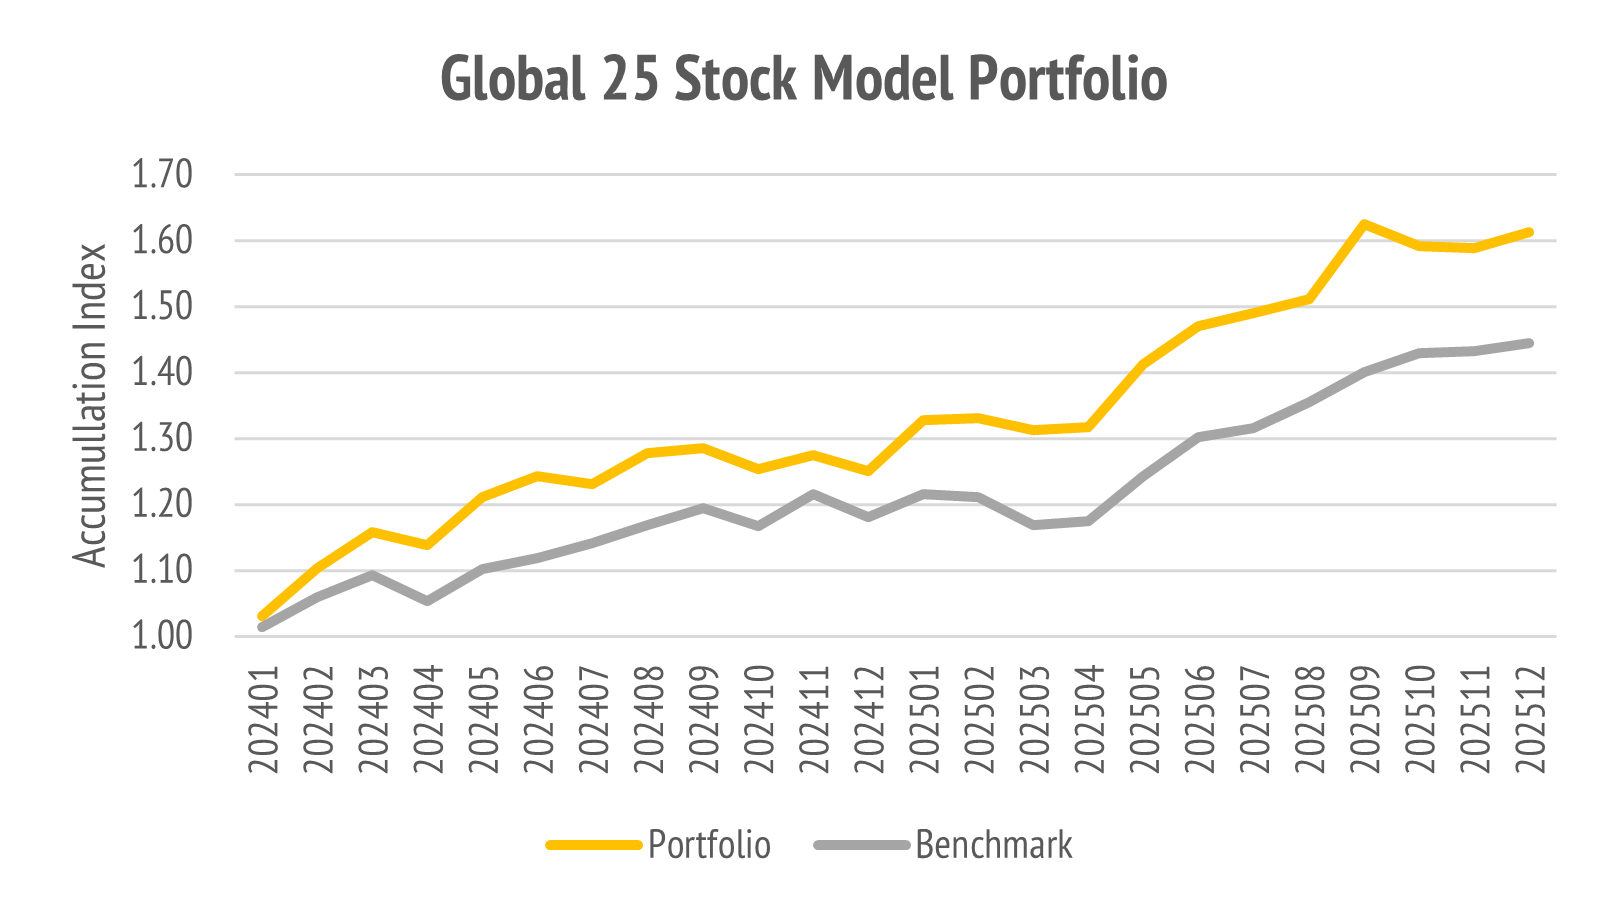
Performance is sometimes easier to view graphically.
Since I have been institutional investor for thirty years, I am looking for reasonable risk return characteristics. These conditions have been benign, with the annualized total return of 24.61% being twice the annualized risk of 11.67%. That is unusual.
The other more technical figure is the so-called relative risk and relative return.
The annualized relative return was 3.12%, which is the outperformance, and this came at a relative risk of 6.93%. This is a so-called Information Ratio of 0.45 = 3.12/6.93.
You need not worry overly much about any of that. I monitor it because it provides a diagnostic to judge whether the performance is commensurate with the risk.
In absolute terms, this period is great. In relative terms, it is decent.
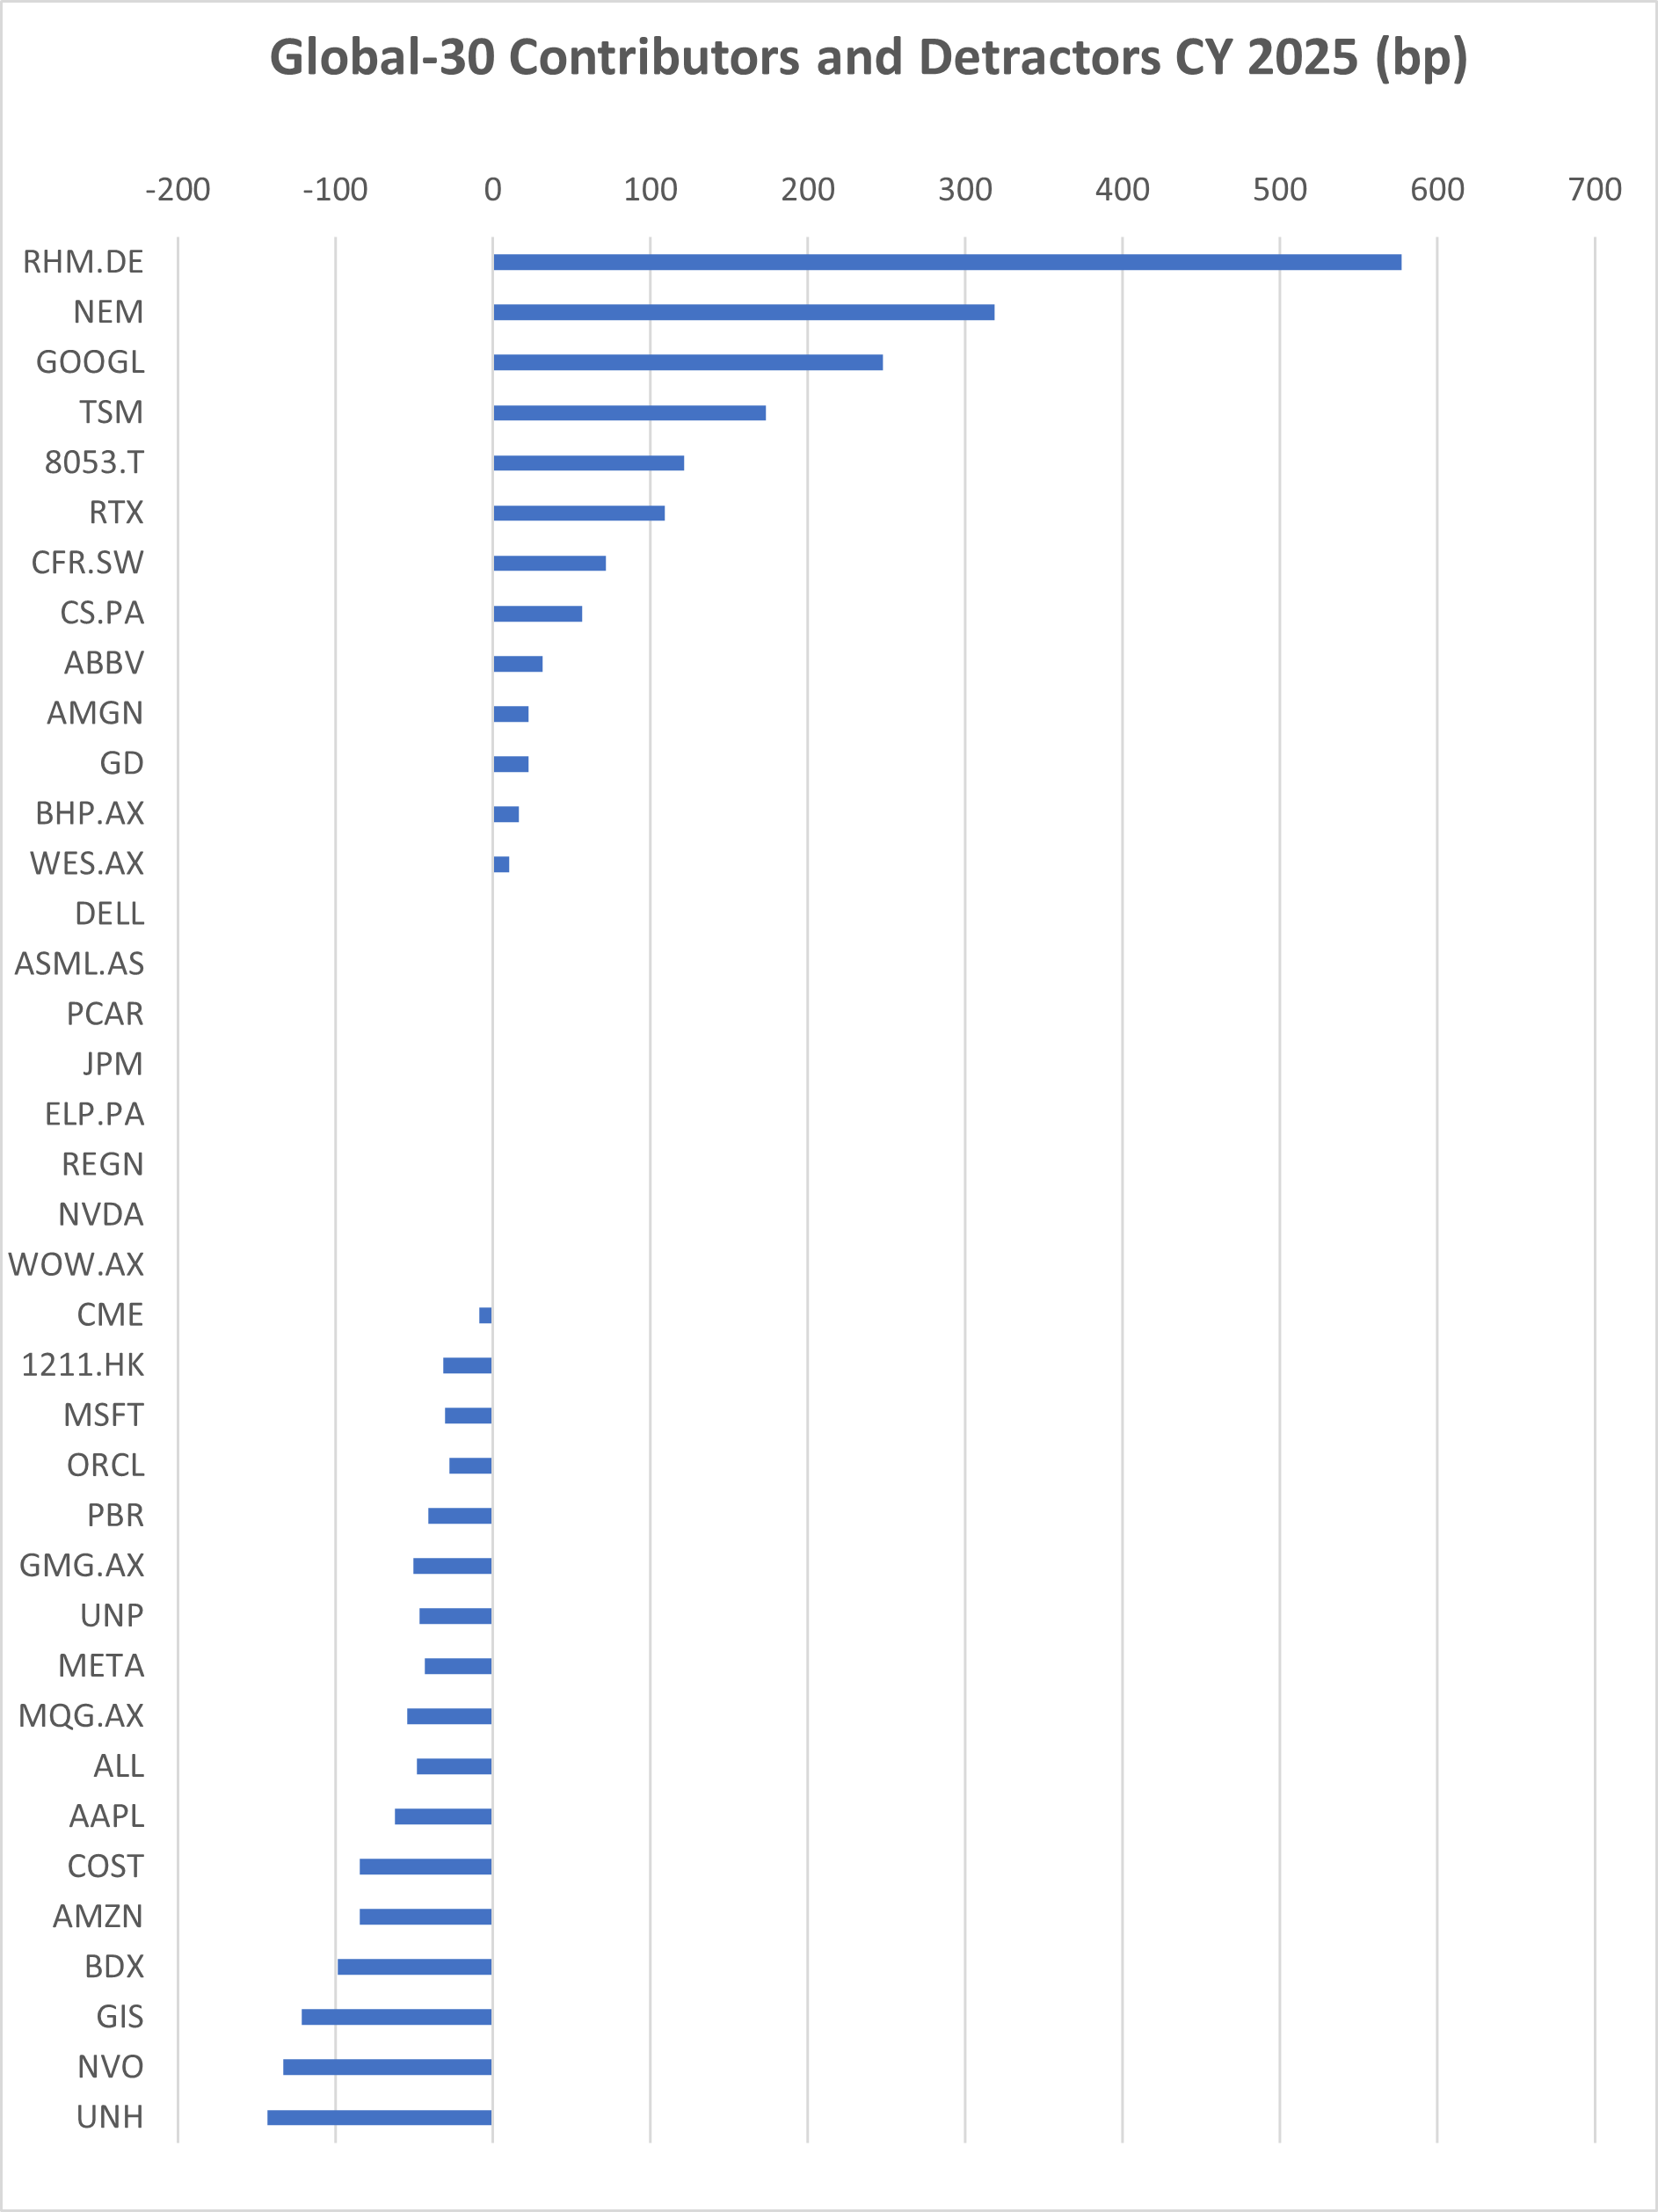
The other chart you will see is a so-called contribution analysis. This is usually done over a period like one-month, one-quarter, or one-year.
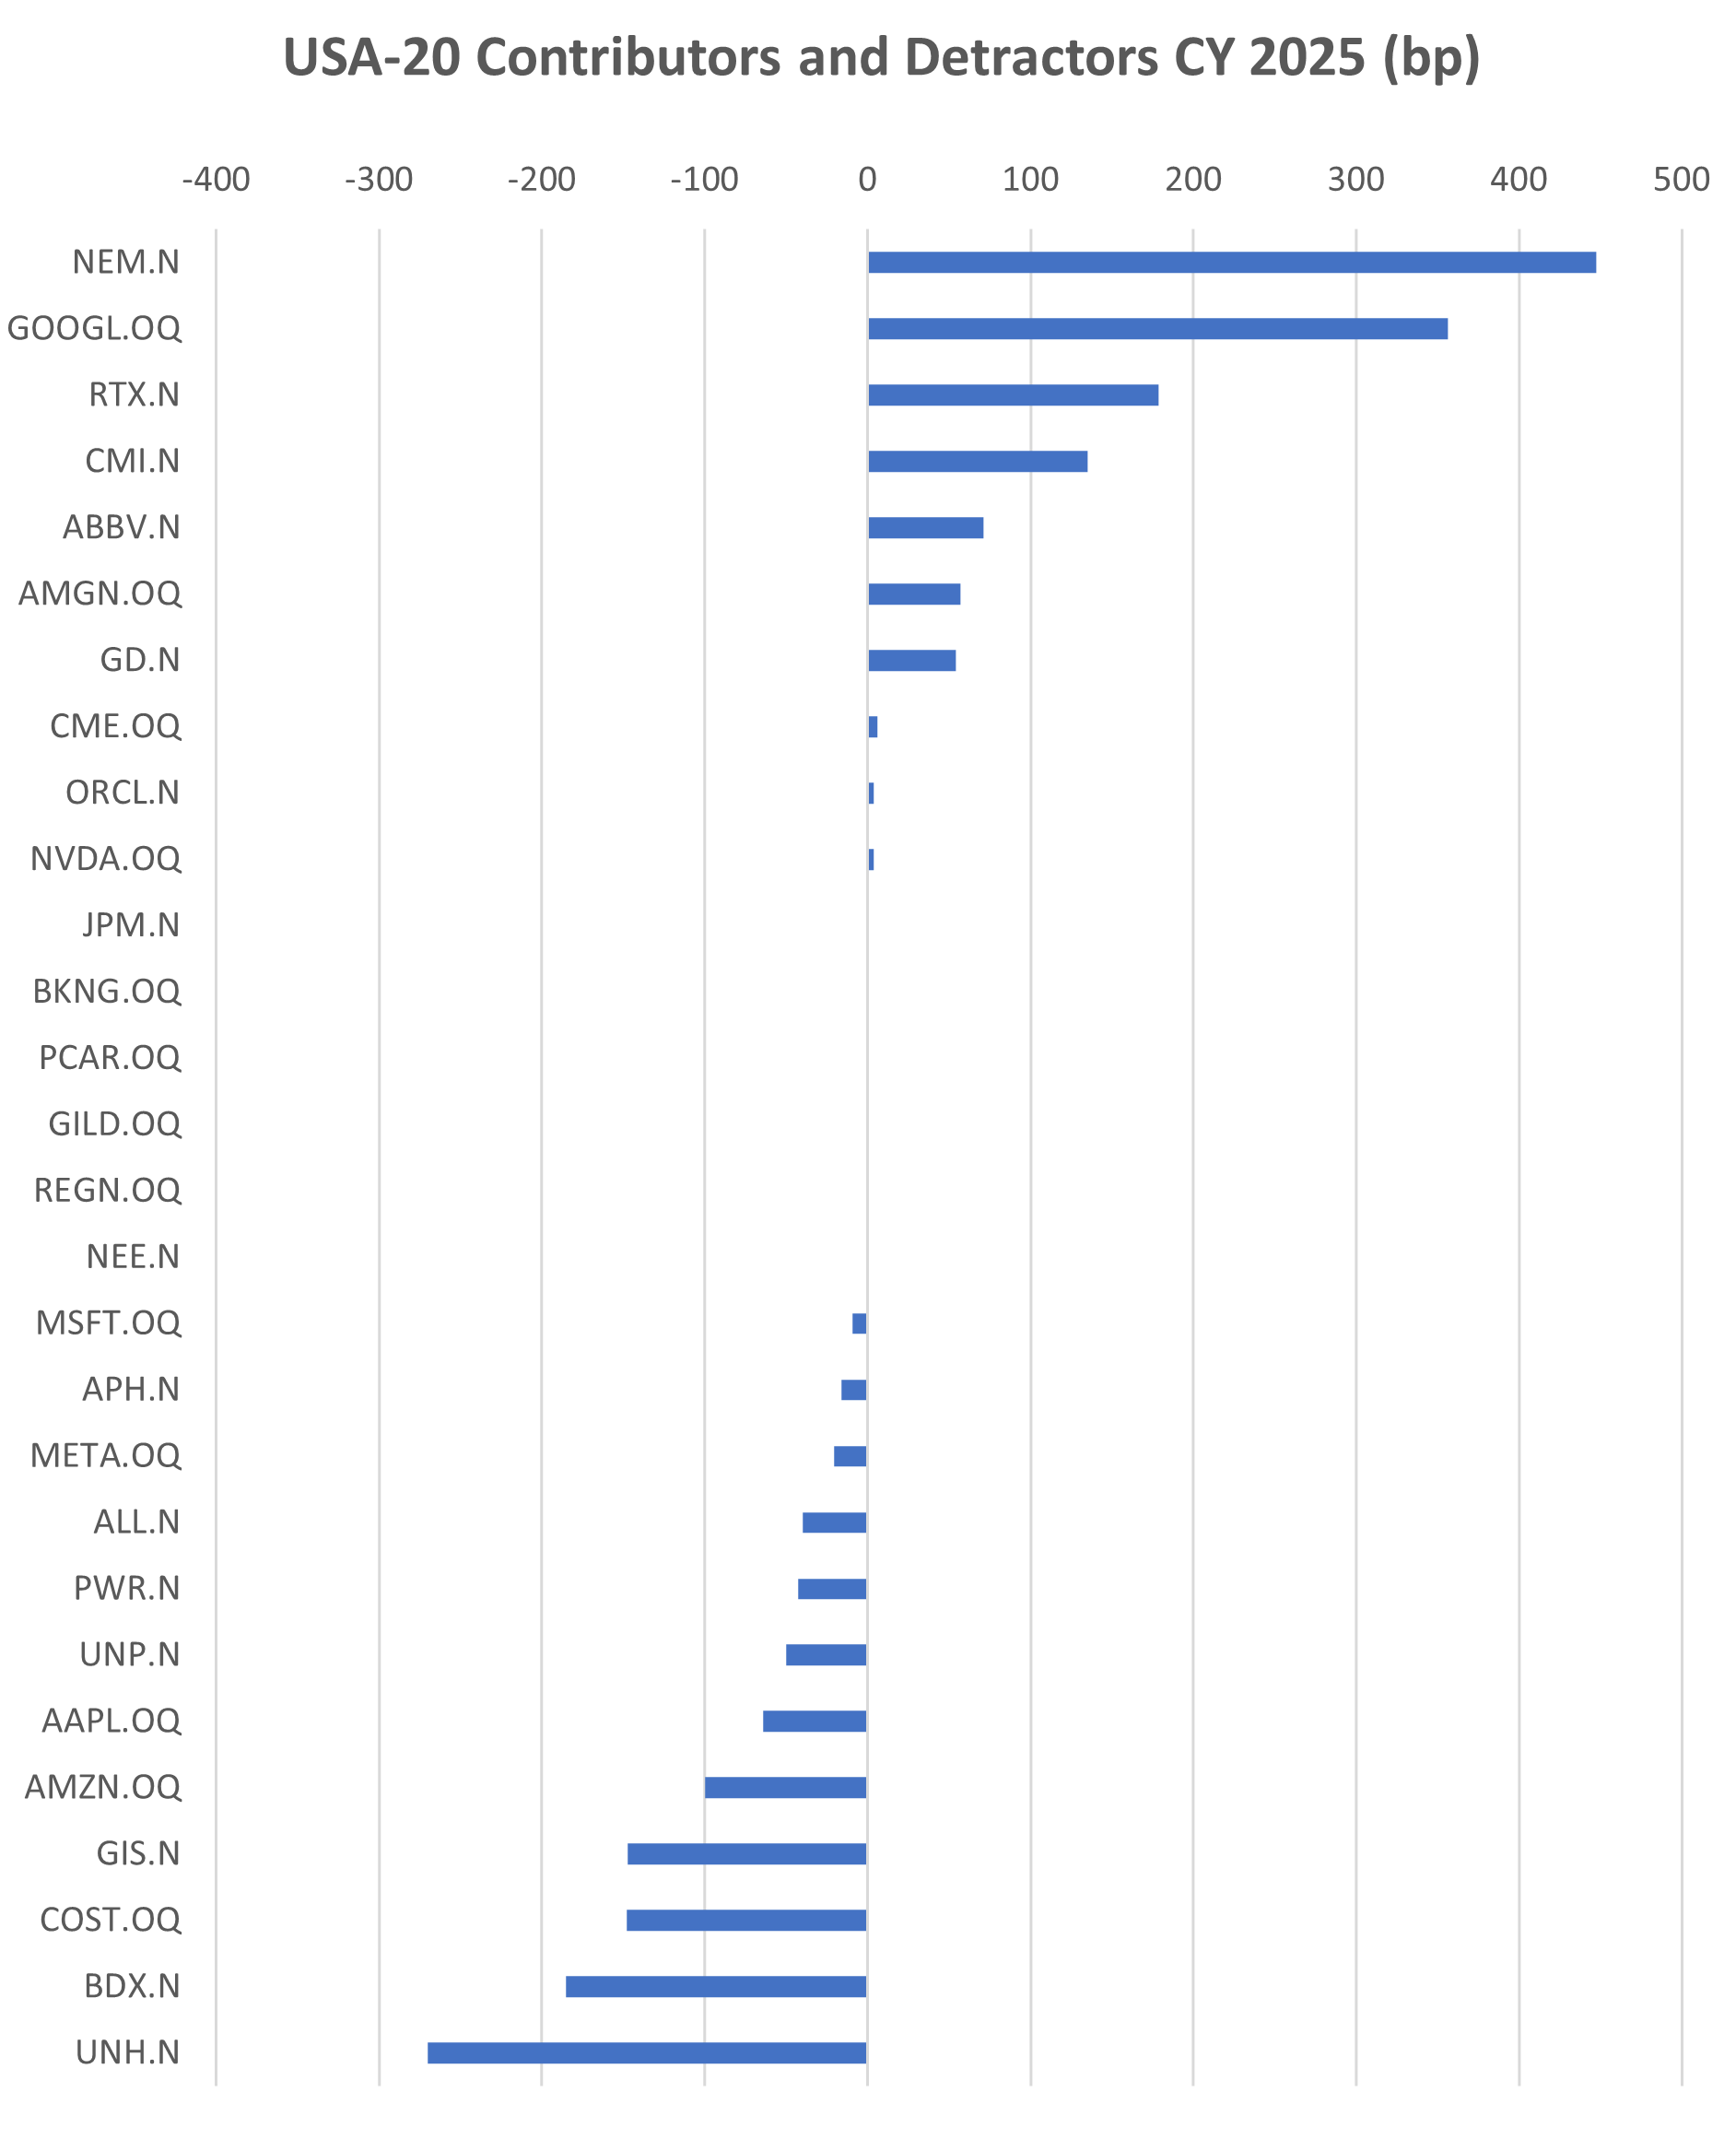
The positive bars represent the stocks that were working well versus benchmark, while the negative bars represent those stocks that detracted from performance.
You can see that Newmont NEM, Alphabet GOOGL and RTX Technologies RTX helped a lot, while United Health UNH, Becton Dickinson BDX, and Costco COST, hurt us.
The reason I look at these charts a lot is to figure out where to do some gardening.
The main thing to look out for is a good balance of skew, namely the extent to which relative winners have longer bars than relative losers. You can diagnose problems in the KISS-philosophy by changing out bad performers or adjusting weights.
Sometimes the only thing wrong with your portfolio is you own too much of stuff that is taking a breather and not enough of the stuff that it out on the cinders sprinting.
If I had to choose one source of error in portfolio management, it is this one.
How much to own in a stock is as important as which stock to own.
The purpose of all of these charts is not bragging but diagnosis.
The International 20 Portfolio
This is a concentrated portfolio of twenty stocks listed outside of the USA, that is benchmarked to the FTSE Global All Cap Index, which is the Vanguard VT ETF.
This portfolio is updated below the paywall.
During the calendar year 2025, this outperformed the benchmark and also did better than the US 20 Model Portfolio. That was consistent with our macro-outlook.
The relative performance was better at 8.15% for a higher relative risk of 10.49% which is not that surprising as the VT ETF includes the USA, which is not owned.
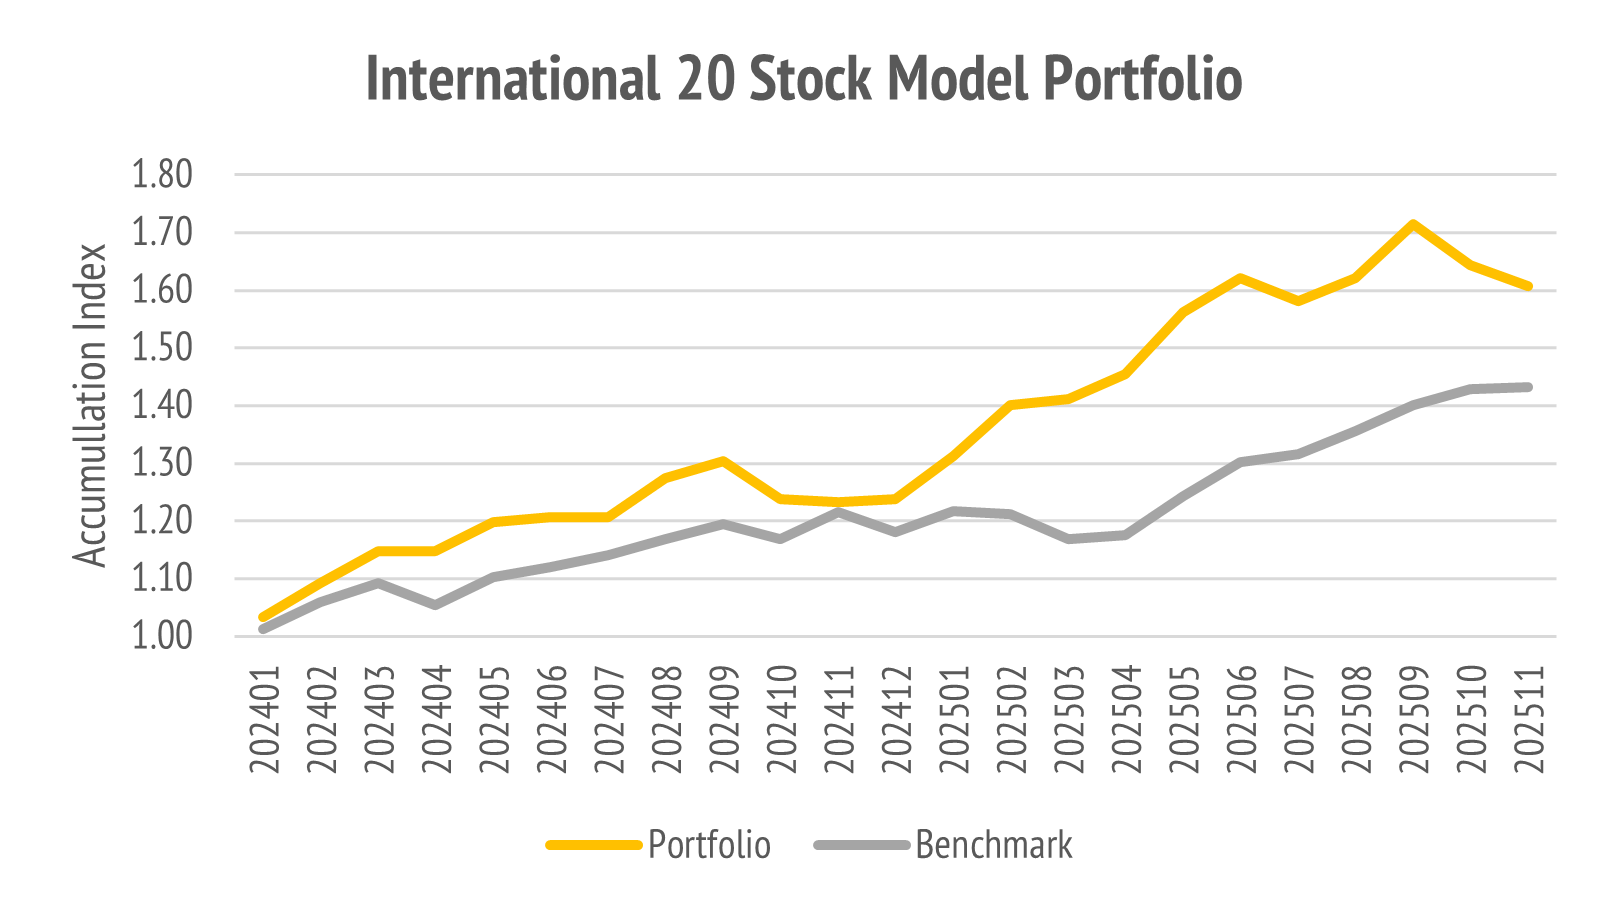
Notice that the graph helps us see more clearly a possible problem looming.
The diagnosis of portfolio problems is best done with contribution analysis.
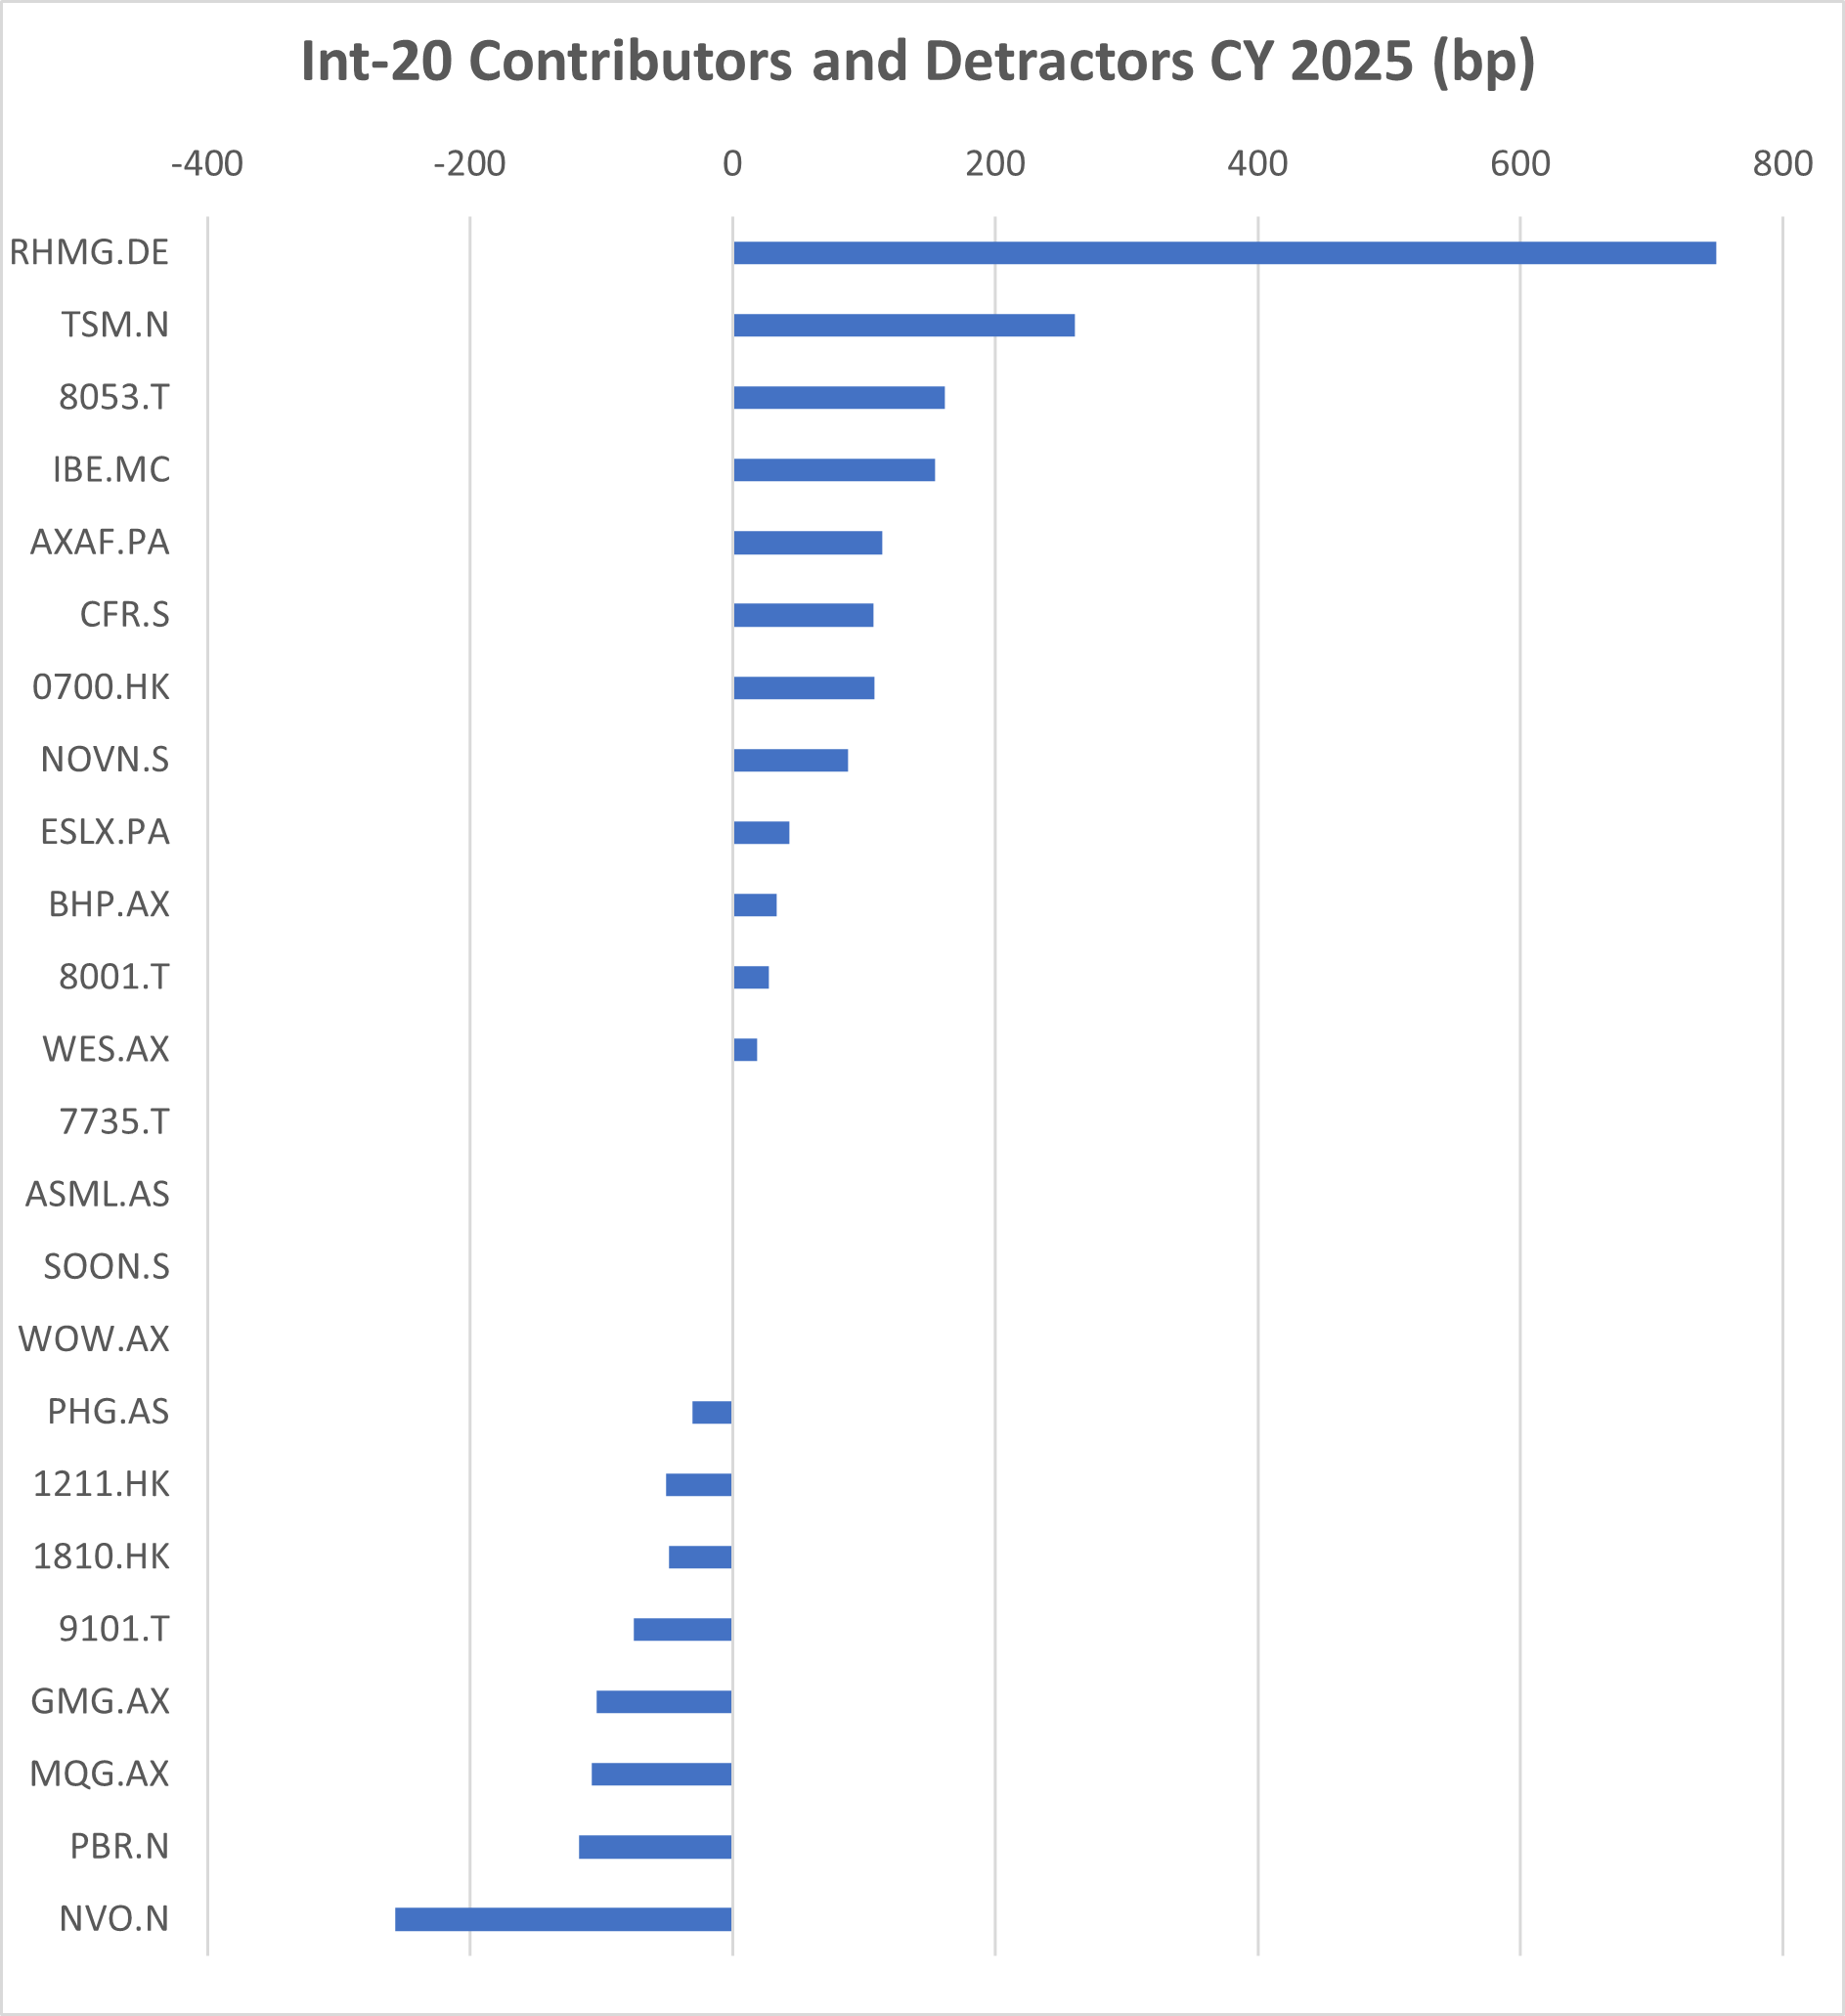
No well performing strategy will stay so without some gardening.
This portfolio clearly needs some.
The Global 25 Portfolio
This is the best ideas from both model portfolios. The benchmark is the World, and so we choose the FTSE Global All Cap Index, which is the Vanguard VT ETF.
Notice that we are technically mismatched on our benchmark for the international model where we chose the same Vanguard VT ETF as the stalking horse.
The reason for this choice is that we need to check whether the international stocks we choose are doing well versus the full opportunity set. That is because we have to make up our minds on fifteen stocks to throw out. How many should be US stocks?
The performance since inception is slightly less than the international model.
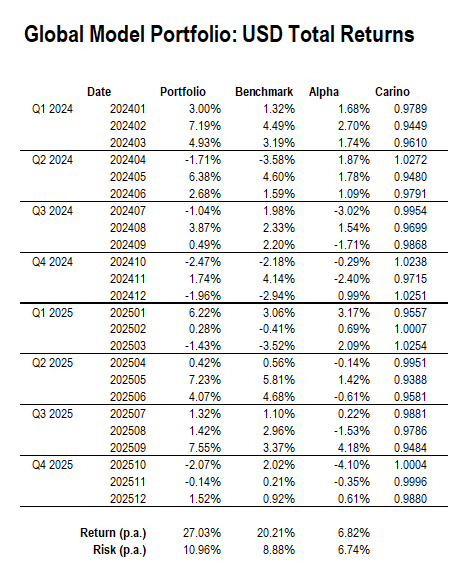
It can be tricky to get this right, which is why I am pointing it out. You can have good ideas but have put them together in the wrong mix. It is an imperfect art, at best.
The summary view is that we have three well-performing strategies, but that we need to fix up an imbalanced state in the International 20 Model and flow those changes through to our Global 25 Model. Otherwise, it looks to be broadly okay.
The updated models are given below.
