


Decades ago, I started my finance career in the bond market. This was a good place to start as it can make use of sophisticated mathematics to sound purpose. The price of money does fluctuate, and with that the relative price of all investments.
The key concept is that all financial prices are relative comparisons.
In an exchange economy, you measure prices relative to the unit of account. This is what we would normally call the currency of exchange, or simply money.
The getting and wanting of money is a primary driver of much human activity.
It does not drive me, but I pay attention as I need money to pay the bills.
Lately the bills for many have been rising due to the cost-of-living crisis.
This is unwelcome, but standard.
Live for long enough, and you will see many such crises.
If you understand better the relative value of financial instruments you cannot fail but to do well in the long run. These move around a lot, and the force of inflation, which changes the purchasing power of money, is the largest force around.
Here is one salutary example I published a while ago. It shows the price of the US S&P 500 index, normally quoted in index points, but measuring aggregate market value in US dollars, in the different base of gold, measured in ounces, and quoted in USD.
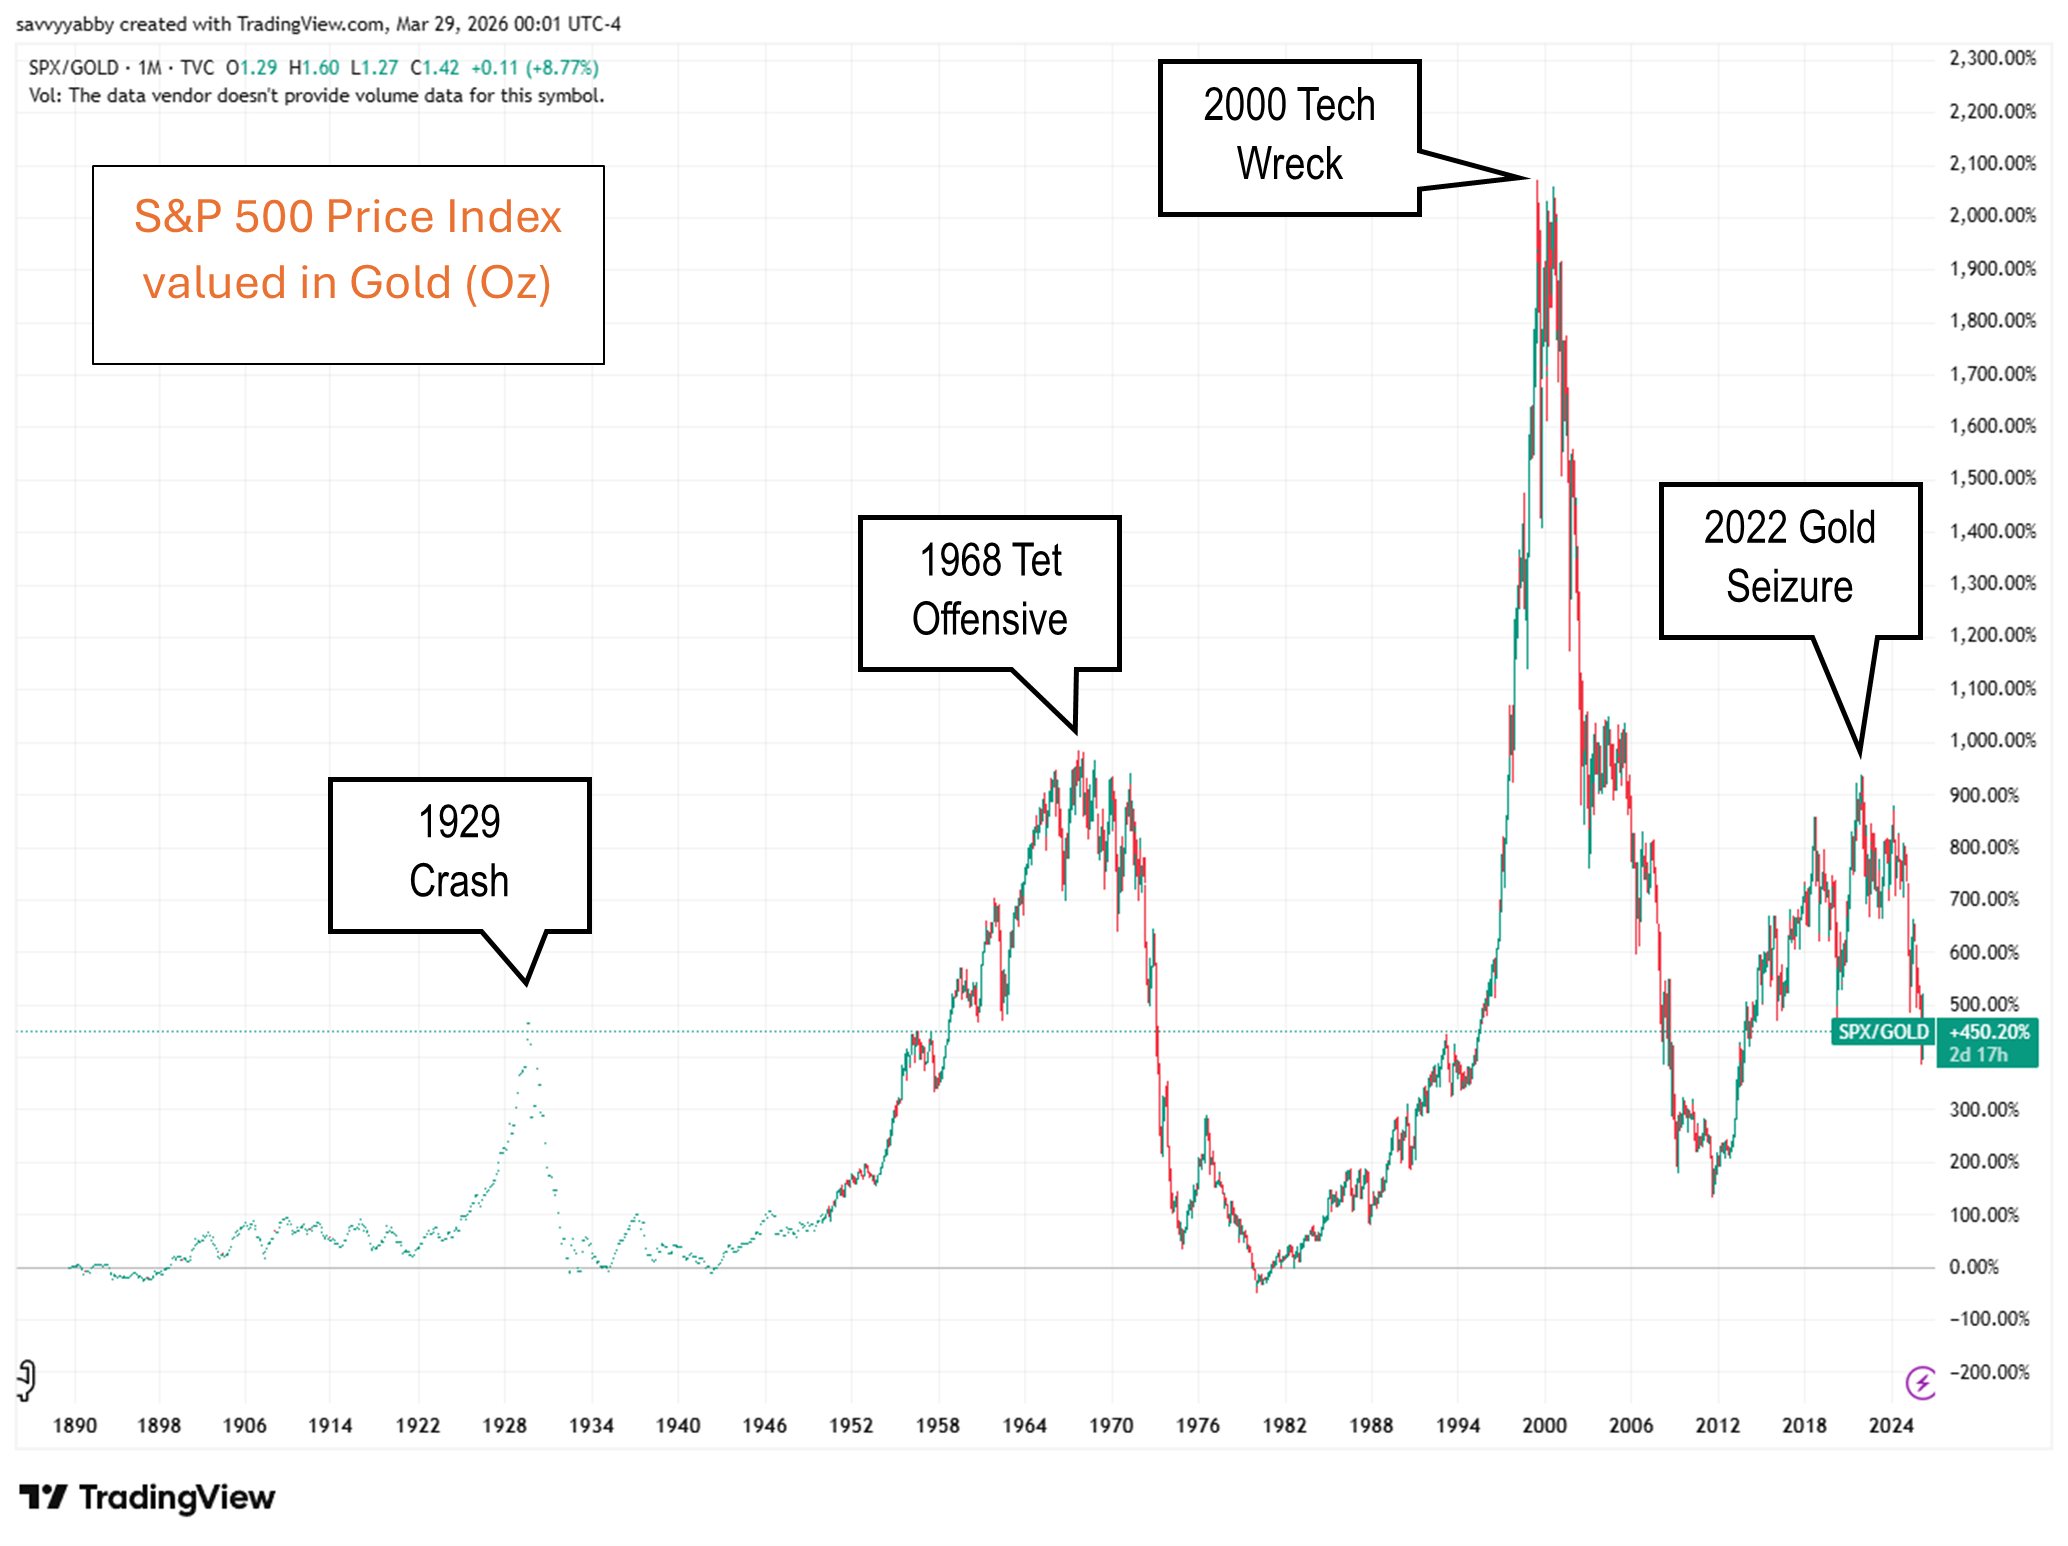
It can take a while to absorb what such charts mean. We are so used to quoting values in familiar money, thought of as fixed scale or ruler, that we can lose sight of how the value of money itself changes over time. The way out of this is to look at ratios.
When you express all prices in the form of ratios you are operating much as a cave man might. How many yams, or truffles if you are a French cave man, do you want? Perhaps you have some mammoth tripe out the back of the cave? Make a price.
You can see from the above chart that swapping between gold and stocks can be very lucrative if you happen to be American and Franklin D. Roosevelt will let you own a bit of the yellow shiny stuff, which was supposed to be the basis of the US dollar.
Notice that the above chart suggests that the heyday for the S&P 500 is already in the past, having peaked relative to gold at the time the USA pinched Russian assets for having had the temerity to start a war of its own without permission.
I wrote at length on this comparison method in my note: Financial Relativity: Relative Return Charts. This includes a detailed description of how to construct price ratios in TradingView (my preferred charting tool). Despite the wonders of digital, there is a relative dearth of good trading chart tools out there. The advent of the UX design crowd had the unfortunate consequence of destroying many financial charts.
Word to the wise: you need volume on your chart and ratio pricing tools.
In the past twenty years, there has been retrograde motion in finance from the influx of software engineers who knew zero about trading. It now shows in the charts!
Software engineers will have new jobs soon so perhaps we can move forward.
That may seem snarky, but it is true. Financial charts were just fine until people with no idea decided to improve them by removing all the vital features on them.
The thing to balance is the attraction of upward momentum in dollar prices for assets with the price of the dollar itself. In my note, Bubble Brewing, from mid-2025, I noted strong conditions for investor sentiment, as measured by cost basis. Investors were sitting on substantial unrealized gains, and so were very positive on stocks.
Look at the SPY ETF (S&P 500), with dividends reinvested, versus the GLD ETF (gold) since the date of that article in mid 2025 (a blue yabby chart bombed the date).
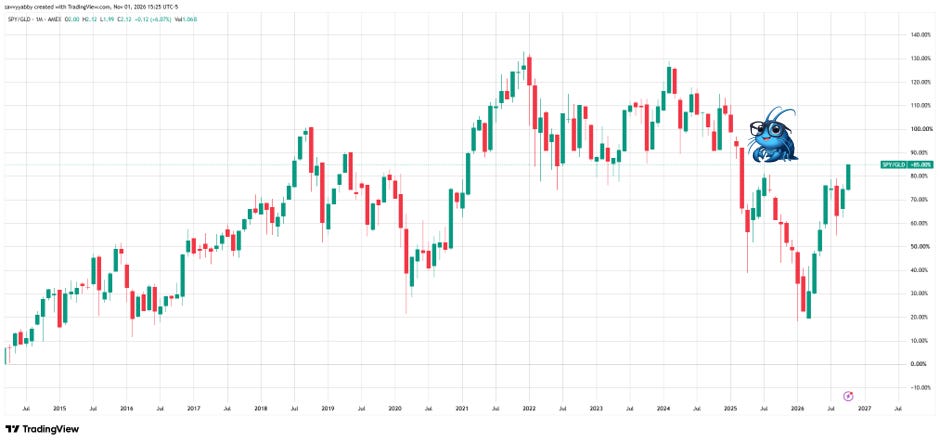
Do you see how confusing market action can be when priced in supposedly fixed units of account, like US dollars, or any other currency, subject to manipulation?
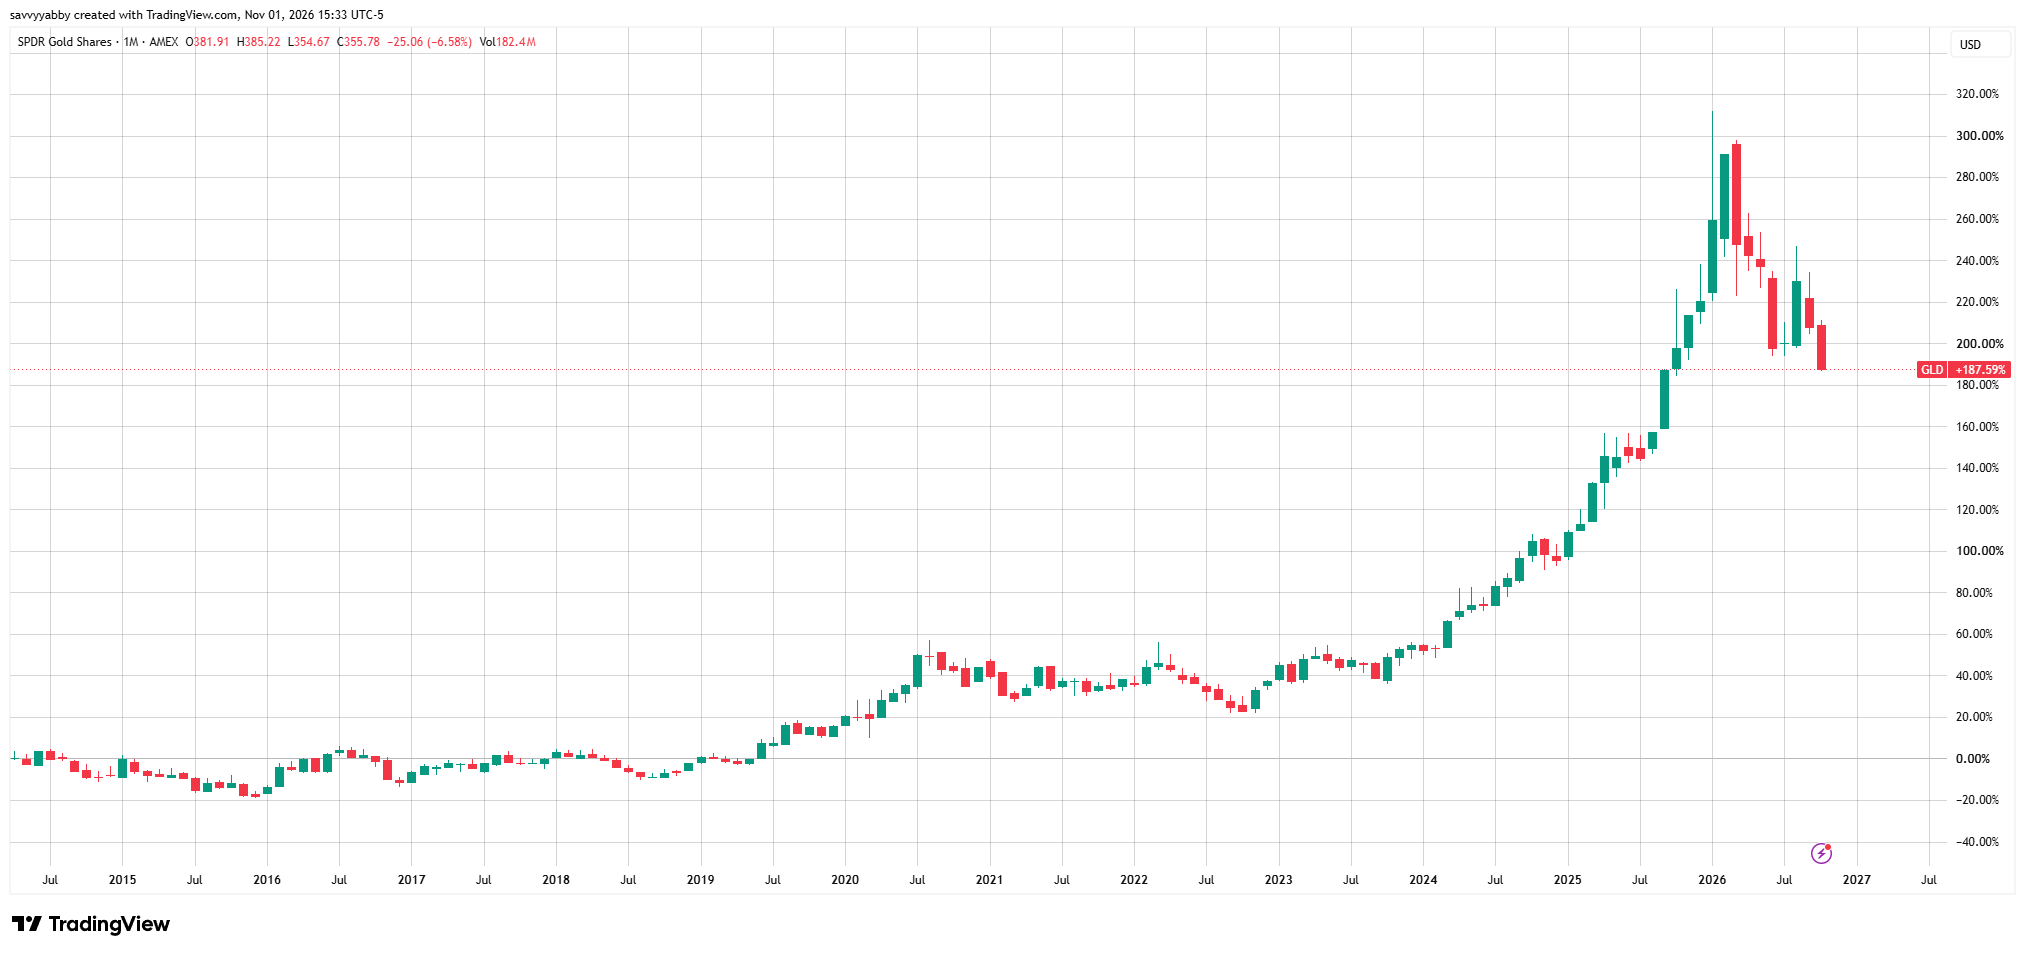
In dollars, gold is down off its highs so we should be cautious.
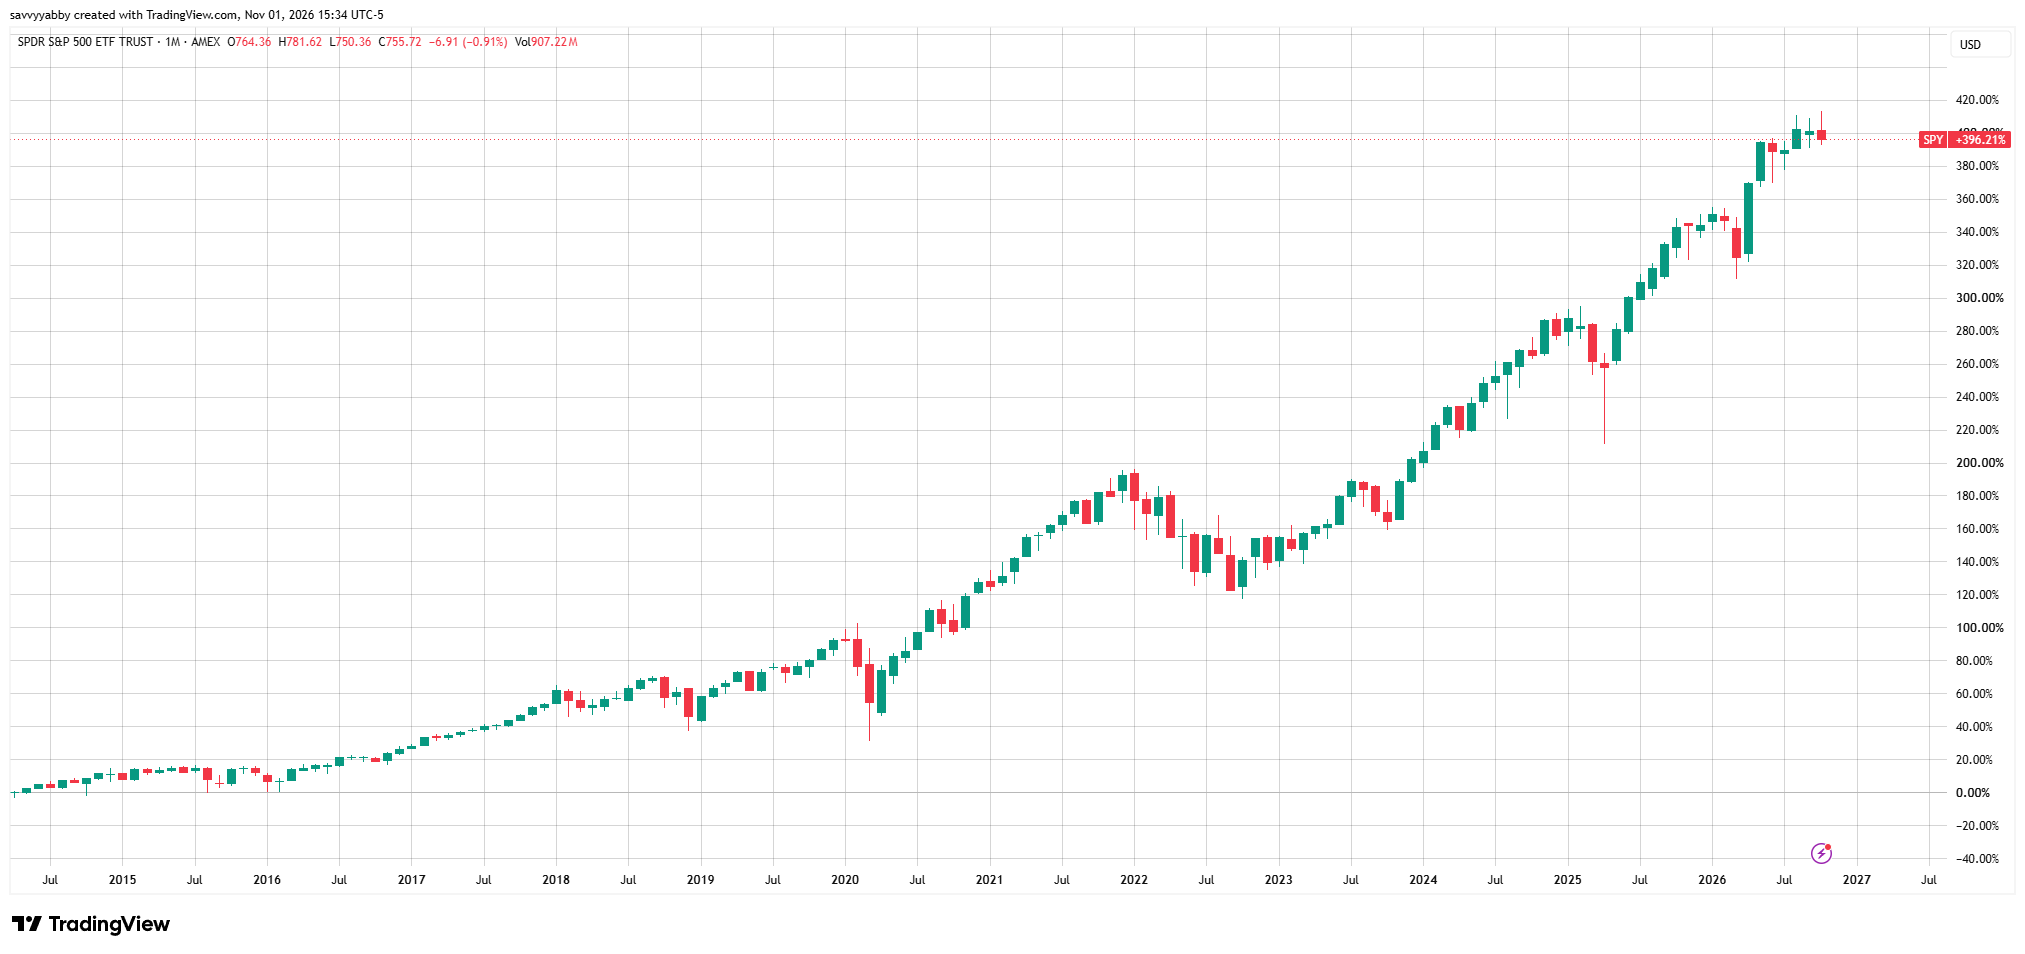
In contrast, the S&P 500 has still been rising and is very close to all time highs.
What are we to make of this outcome?
Clearly, the opportunity cost of holding gold has not greatly harmed investors over the period since that article Bubble Brewing. Are we to assume that the coast is now clear for the geopolitical tensions that drove gold higher?
The Global Power and Energy Transition
You may recall that I advanced a Tripolar model for the Global Power & Energy Transition as the conceptual framework that informs my thematic investing.
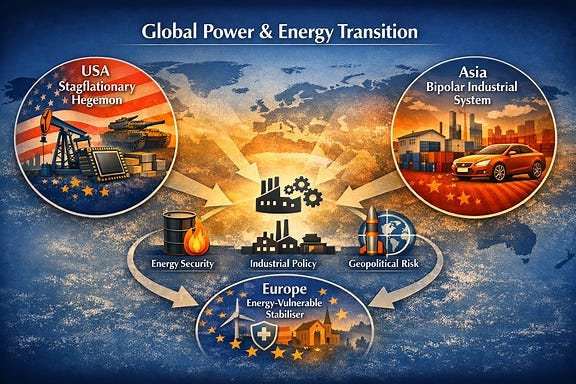
This model presumes that geopolitical power is a derivative of industrial power and that the power of the Asian region is rising. In this model, the USA remains the most consequential power in terms of the decisions it makes. They affect everybody and everything, but that does not mean that control lies with the hegemon.
The characteristic of megalomania is to seek ever expanding control.
However, the seeds of decline are created by overreach. The USA is a very great and powerful nation, but it has an Achilles Heel in the form of too much debt.
This is why gold has rallied through this cycle.
However, gold bears no monetary interest, and interest rates are now rising around the world. Australia is among the leaders in this game, since our domestic inflation remains stubbornly high. However, this is true in most places outside of China.
In this above tripolar model, each major region plays a distinct role.
The United States is the stagflationary hegemon: the only major economy that benefits from higher oil prices, armed with energy dominance, fiscal dominance, and a defence‑industrial complex expanding at the fastest pace in decades.
Europe is the energy‑vulnerable stabiliser: a region forced into strategic re‑militarisation while relying on healthcare, utilities, insurance, and high‑quality cashflows to buffer the shocks of imported energy and slow growth.
China is the industrial deflation engine: the world’s producer of electrification hardware, operating under deflationary pressure and energy insecurity, and doubling down on the sectors it considers strategically indispensable—EVs, batteries, energy security, telecoms, and financial stability.
Japan is the industrial reflation engine: the mirror image of China, with rising wages, rising capex, defense expansion, and a once‑in‑a‑generation industrial renaissance driven by supply‑chain rewiring and BOJ normalization.
Around these four pillars sit the essential minor players in Asia:
Taiwan anchoring semiconductor sovereignty
Singapore anchoring Asian financial stability
South Korea for semiconductor and smartphone diversity
Australia anchoring hard‑asset supply
Together, these roles form the architecture of our portfolios.
Notice that this framework was penned a few weeks into the USA-Israel war on Iran. There I wrote that the USA is the only major economy to benefit from higher prices for oil, and that it enjoys financial and military-technological dominance.
Two points are noteworthy since then:
The USA has had options to close down this war but has not done so
Energy prices keep rising along with talk of technology dominance
We are told that Artificial Intelligence is now so advanced that many human roles can be completely replaced. We are also told that the USA leads in Superintelligence.
Forgive me for providing some needed social commentary:
The USA is now global megalomania central.
This does not make it a bad place to invest capital, but we need to very careful about what comes next in this market cycle. The charge for Total World Domination has a small but inescapable flaw in the glass: the US balance sheet is deteriorating.
This is not only true of the government.
The breakneck pace of capital expenditure to achieve transhuman world domination, and perhaps that of the hereafter, is starting to turn great technology franchises, like Alphabet XNAS: GOOG, into negative free cash-flow debt issuance junkies.
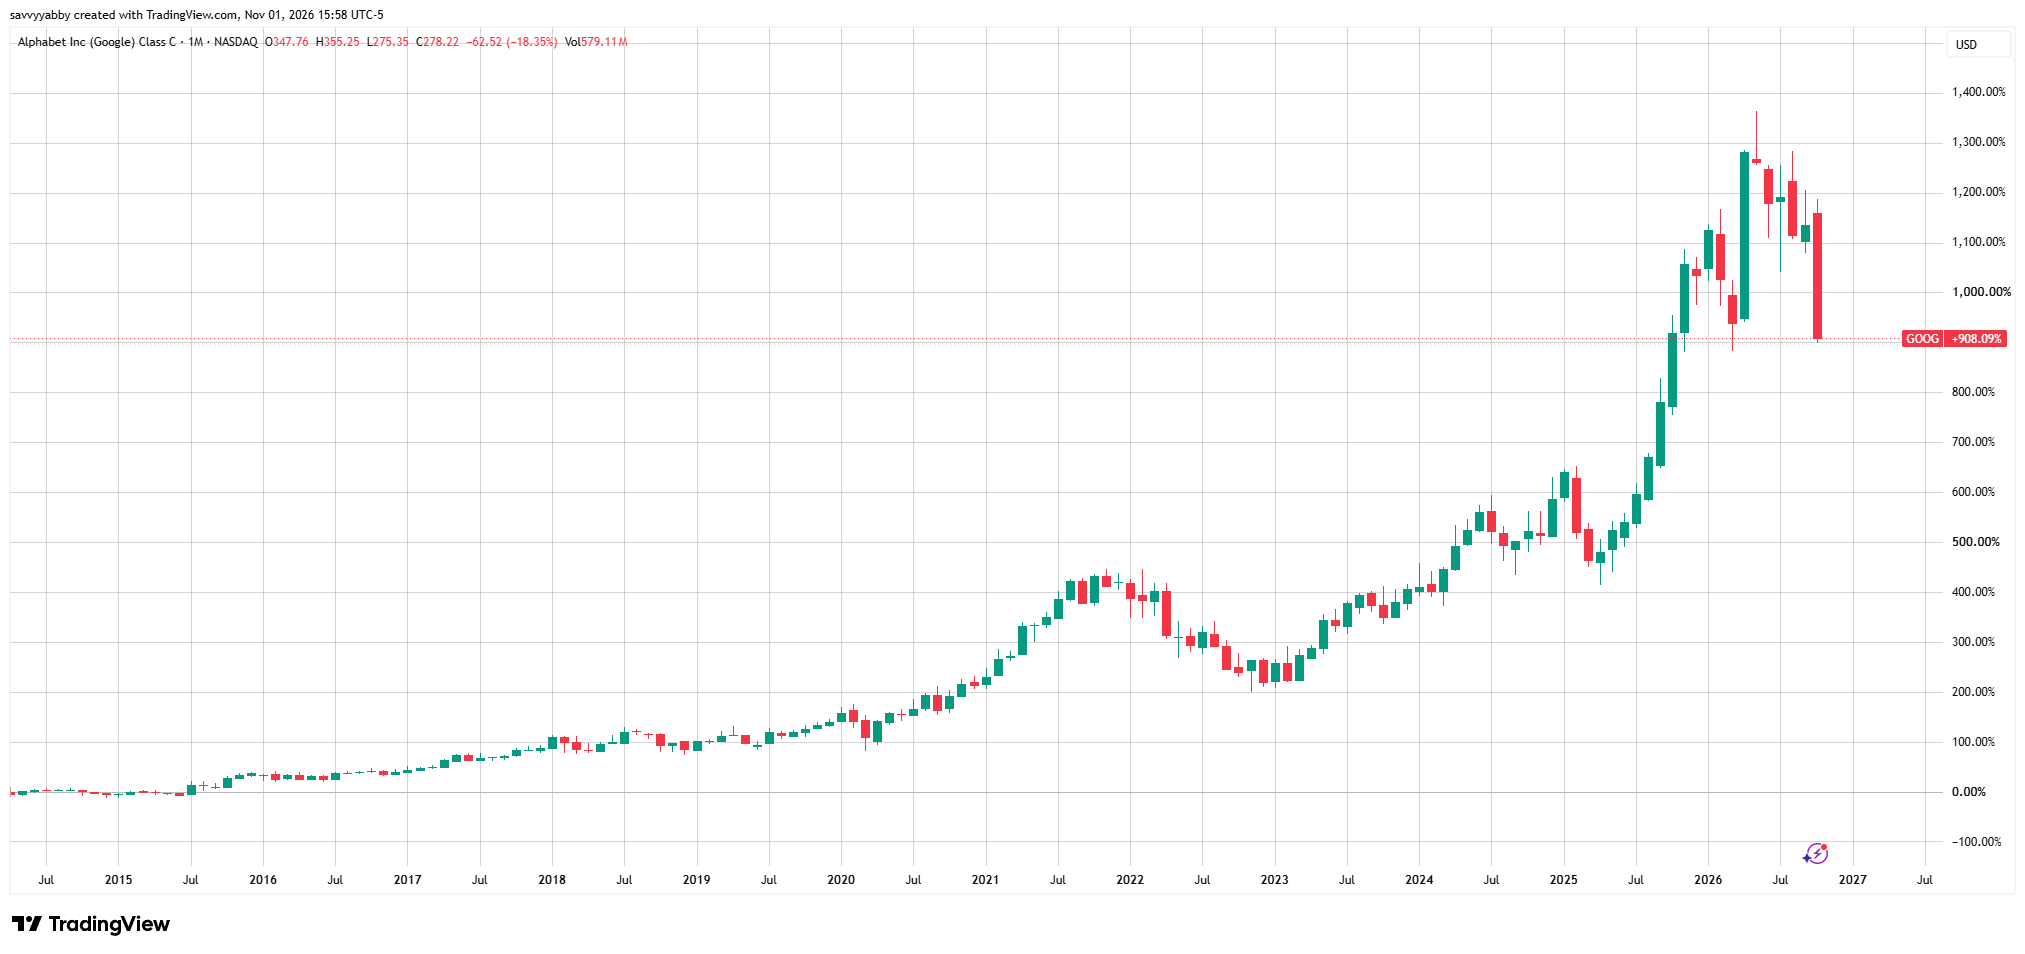
The problem with megalomania is ever and always the same.
You think your rule the world until the bond market shows up.
The bond market is not a moral force, nor is it especially wholesome. It is simply that place where prices are made on humans keeping their promises. There is a very old English saying: “My word is my bond.” Make a promise. Others watch to see it kept. Once you make too many promises you cannot keep. their value falls.
The Investment Value of Bonds
Remember that a bond is a form of loan that is tradeable. You lend the bond issuer some money, the principal, and they promise to pay you back. To show their good faith and make it worth your while to lend over a long period, the borrower pays coupon interest over time. The thing to watch is creditworthiness.
The math of bonds is interesting and subtle.
Since the price of money fluctuates all of the time, the value of a bond in trade for other financial assets, like cash, moves around constantly.
This leads to a number of behavioral psychology traps for investors.
While a bond genuinely does promise return of capital and (often) a fixed rate of interest over the life of the bond, there are always new rates on offer.
Investors can buy and sell bonds in the secondary market.
It is not always the case that you have good liquidity, but prices are made in the larger global bond markets, like that of the USA, and retail investors can trade them.

There are many things to be careful of when trading in bonds, and I aim to explain some of those in coming notes, but the markets are well developed globally.
Australia is a bit of an exception to this rule. Retail investors can buy some bonds in an ordinary brokerage account, but this is generally limited to Australian Treasury Bonds.
Someday I will share more on the history of Australian securities markets. Going back in time to the period from 1950 to 1980, Australia had a very active bond market for retail investors on the Australian stock exchanges. That all died post 1980. I do not know exactly why that happened, but our market is now very opaque.
In place of direct holdings of bonds, one can buy bond ETFs. I will cover that, although it is less than ideal for exploiting some of the cyclical anomalies of bond markets.
Suffice to say that some exposure to bond markets is readily achieved via ETFs.
The other factor to note is that the tax accounting for fixed income investments can be very different to that for stocks, especially when they are held directly. Australia employs a peculiar tax regime that can be very disadvantageous for direct bond investment unless you meet certain criteria, like the pension phase of an SMSF.
Part of the reason that I am returning to bond investment after a twenty-five-year hiatus is because I will be converting part of my SMSF to pension phase. The tax treatment of bonds in pension phase is very different to accumulation phase.
Generally speaking, the Australian financial advice community does a poor job of explaining fixed income investment to their clients. This is odd as retirement is an income and capital preservation oriented stage of life. Perhaps due to financial inducements, namely trailing commissions on the sale of mortgages, investors targeted residential real estate in their self-managed portfolios.
You can use real estate to back an annuity income stream for retirement, but the assets are very illiquid and come with high holding costs.
I do not favor using a real estate portfolio as a retirement funding asset.
You are entitled to think and do otherwise. I am just explaining my stance.
The Market Schwerpunkt (Gold vs. Bonds)
To cut to the chase, on why I am doing this now, let me reprise an earlier piece from February 2026: The Market Schwerpunkt (Gold vs. Bonds), in which I explained how and why I look at the relative return of gold and bonds as a key market signal.
I opened that article with this comment:
The geopolitical contest between the USA and China is taking on the complexion of open economic warfare. We do not think the USA will win. Here we explain why.
This was not a call that the USA would “lose” but a rejection of the notion that there is any way to “win” in this contest between two economic titans. The best way to prevail in a contest of this scale is simply not to play the game of economic warfare.
I wrote that, the USA cannot possibly win against China, in any contest, if it should choose to match its areas of weakness against Chinese areas of strength.
The basic principle of strategic competition is to deploy strength against weakness. The wrong thing to do is to attack where the line is strong.
Under the Trump Administration, the USA has chosen to undermine its own areas of institutional strength, by degrading the rule of law, weakening social cohesion, through a deliberate attempt to isolate and denigrate minorities, and to alienate its own allies with an ever-changing kaleidoscope of punishments and humiliation.
Since I wrote that piece, the USA and Israel started a new Middle Eastern war whose stated objective is to prevent Iran acquiring a nuclear weapon. Iran does not seem to be bowed by the damage done to its military, economy, or society. Since the place is made of granite mountains, like a natural fortress, I do not see any prospect that the USA can prevail in this war. They may well nuke Iran, in which case that state will be motivated to go build a nuclear weapon of its own. That is highly likely.
The Achilles Heel for the USA is the high level of government debt accompanied by a rising level of corporate debt to fund an ambitious reindustrialization program. Debt loads are increasing rapidly at the same time as interest on debt is rising. There may be some hope of inflating debt away, but not if you seek competitiveness. Higher domestic price levels in the USA for everything from memory chips to diesel, will eventually bite on the ability to keep growing the economy this briskly.

China has significant public and private debt and is in the midst of a disinflationary slump caused by the bursting of their real estate bubble. The nation has large and efficient manufacturing capabilities that are depressing manufactured prices.
The effect of China is to place a disinflationary damper on world price levels. The one exception to this rule is commodity inputs, like energy, metals, food and fertilizer.
For this reason, we have a seen a general increase in the price level of commodities even though the manufactured price of Chinese exports has been falling.
If anything, the effect of this war in the Middle East has been to hurt the profit margin of Chinese industry making further expansion more difficult. Should this really bite we may see a further slowing in the rate of economic growth and weaker commodities.
Notice the clear risk here: the global economy may well slump.
Superficially, this may look like a “win” for the USA, but I do not think so. There is a very simple Fallacy of Composition in play. Should China weaken, due to sustained higher prices for energy, and a global shortage of diesel, this weakness will soon appear around the world, as China is a key driver of commodities demand.
It can be difficult to appreciate this link in the modern era of fiat money. In order to remove the noise that comes from that, it is helpful to look at data covering the first industrial revolution, back in the 19th Century, during the Age of Steam and the Rail Investment Boom, that was global. There is a fine study due to the US economist Frederick R. Macaulay: Some Theoretical Problems Suggested by the Movements of Interest Rates, Bond Yields and Stock Prices in the United States since 1856. There is an electronic copy available on the National Bureau of Economic Research website.
This graph shows commodity prices versus interest rates for the period covering the First Industrial Revolution in the USA and the UK.
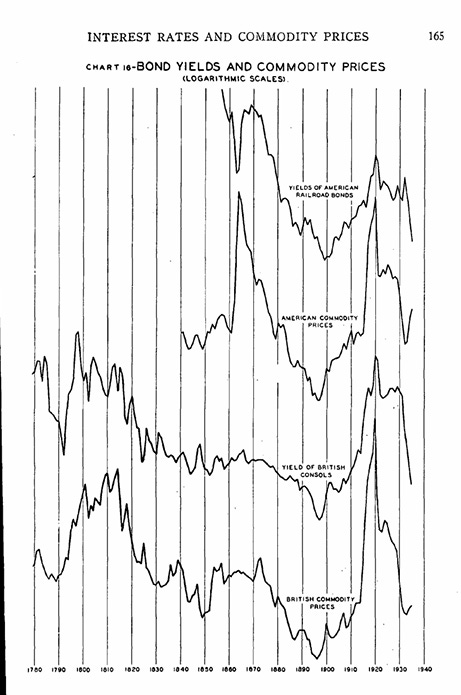
Note that interest rates move inversely to commodity prices. This means that bond prices were falling as commodity prices rose, and vice versa.
The context for this comparison is the visible comparison between the physical buildout of railways in the late 19th Century and the current data center frenzy.
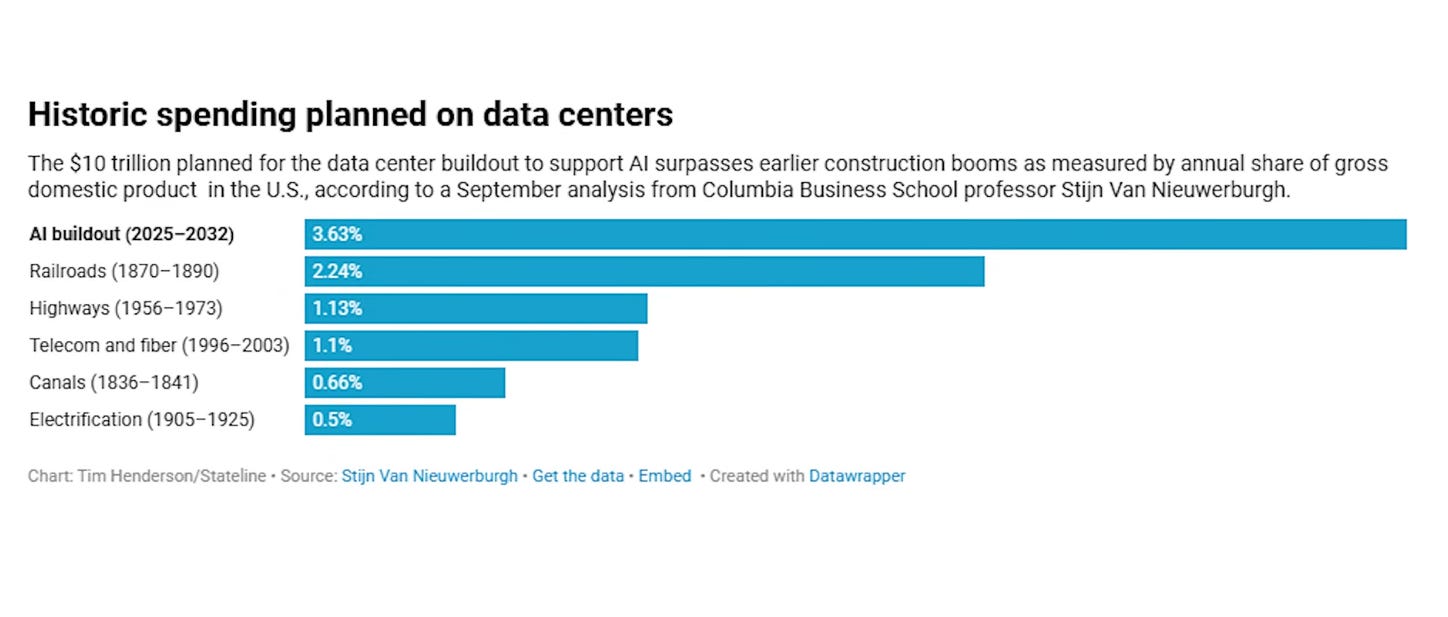
Those who are old enough to remember the 1990s tech frenzy may recall the magic phrase of “frictionless capitalism”, the quaint notion that all constraints from physics had been banished by the digital revolution of information technology.
The computer bit costs nothing to create and nothing to transmit.
Supposedly, the growth rate of the economy would lift massively to an age where everything was super abundant. Our lives would improve immeasurably.
There was a kernel of truth to this idea, and digital technology did prove very useful for a host of applications and great fortunes were made off the back of it.
The only problem is that you needed loads of optical fiber, new information railroads, to shunt the cat videos around the planet and make us all super proud owners of an email inbox with the constant refrain: “You’ve got spam!”. It was both good and bad.
In the workout of the tech-wreck, many fine firms, like Sun Microsystems, found out that having the best technology would not help fend of acquisition. Technology is deflationary by nature, so vast pyramids of debt look shaky in a downturn.
Sun Microsystems fell to the ravages of Linux, the open-source operating system that killed off Solaris and expensive workstations. Oracle moved in to buy the carcass for the revolutionary programming language called Java. The rest is history.
If you come full circle, Oracle XNAS: ORCL has put its own hand up to find a new role in the digital firmament, probably in the arms of another with a better balance sheet.
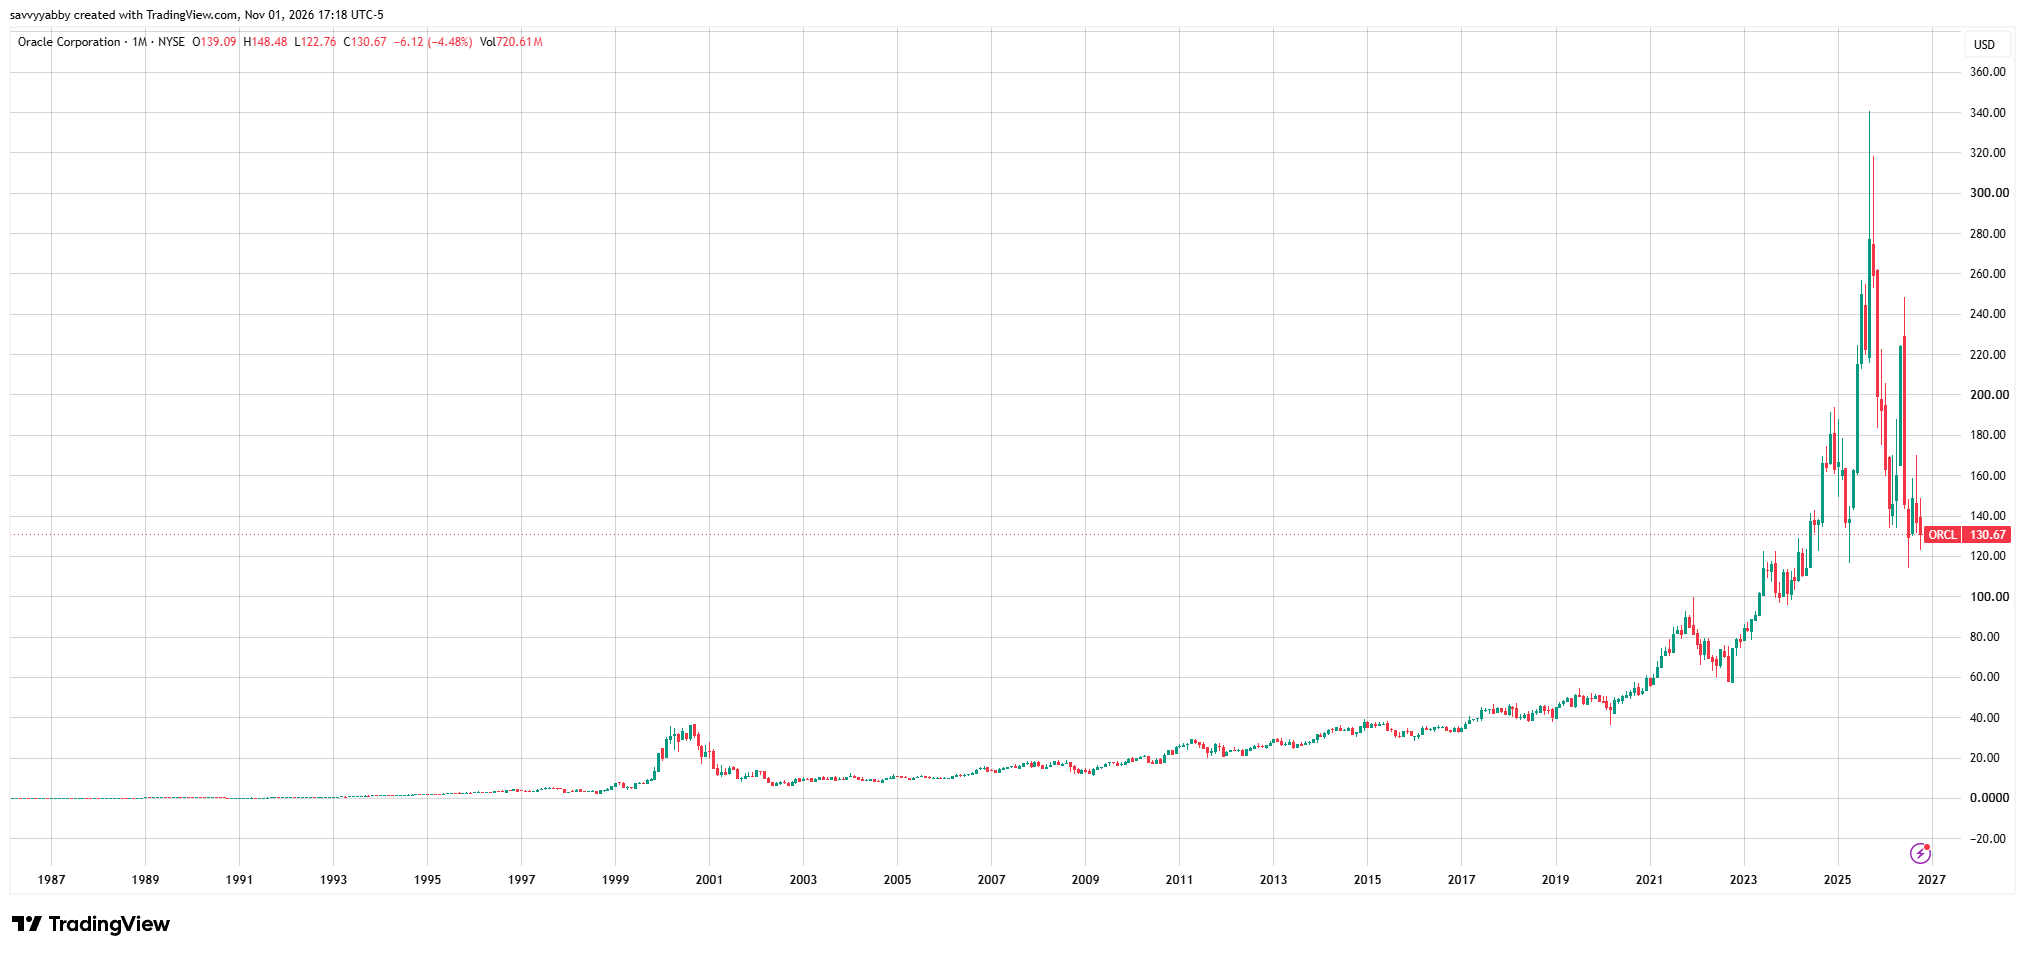
The race for the winner’s circle with Oracle came with a huge debt binge to buy chips and secure data center capacity for leasing. The bond market now smells blood.
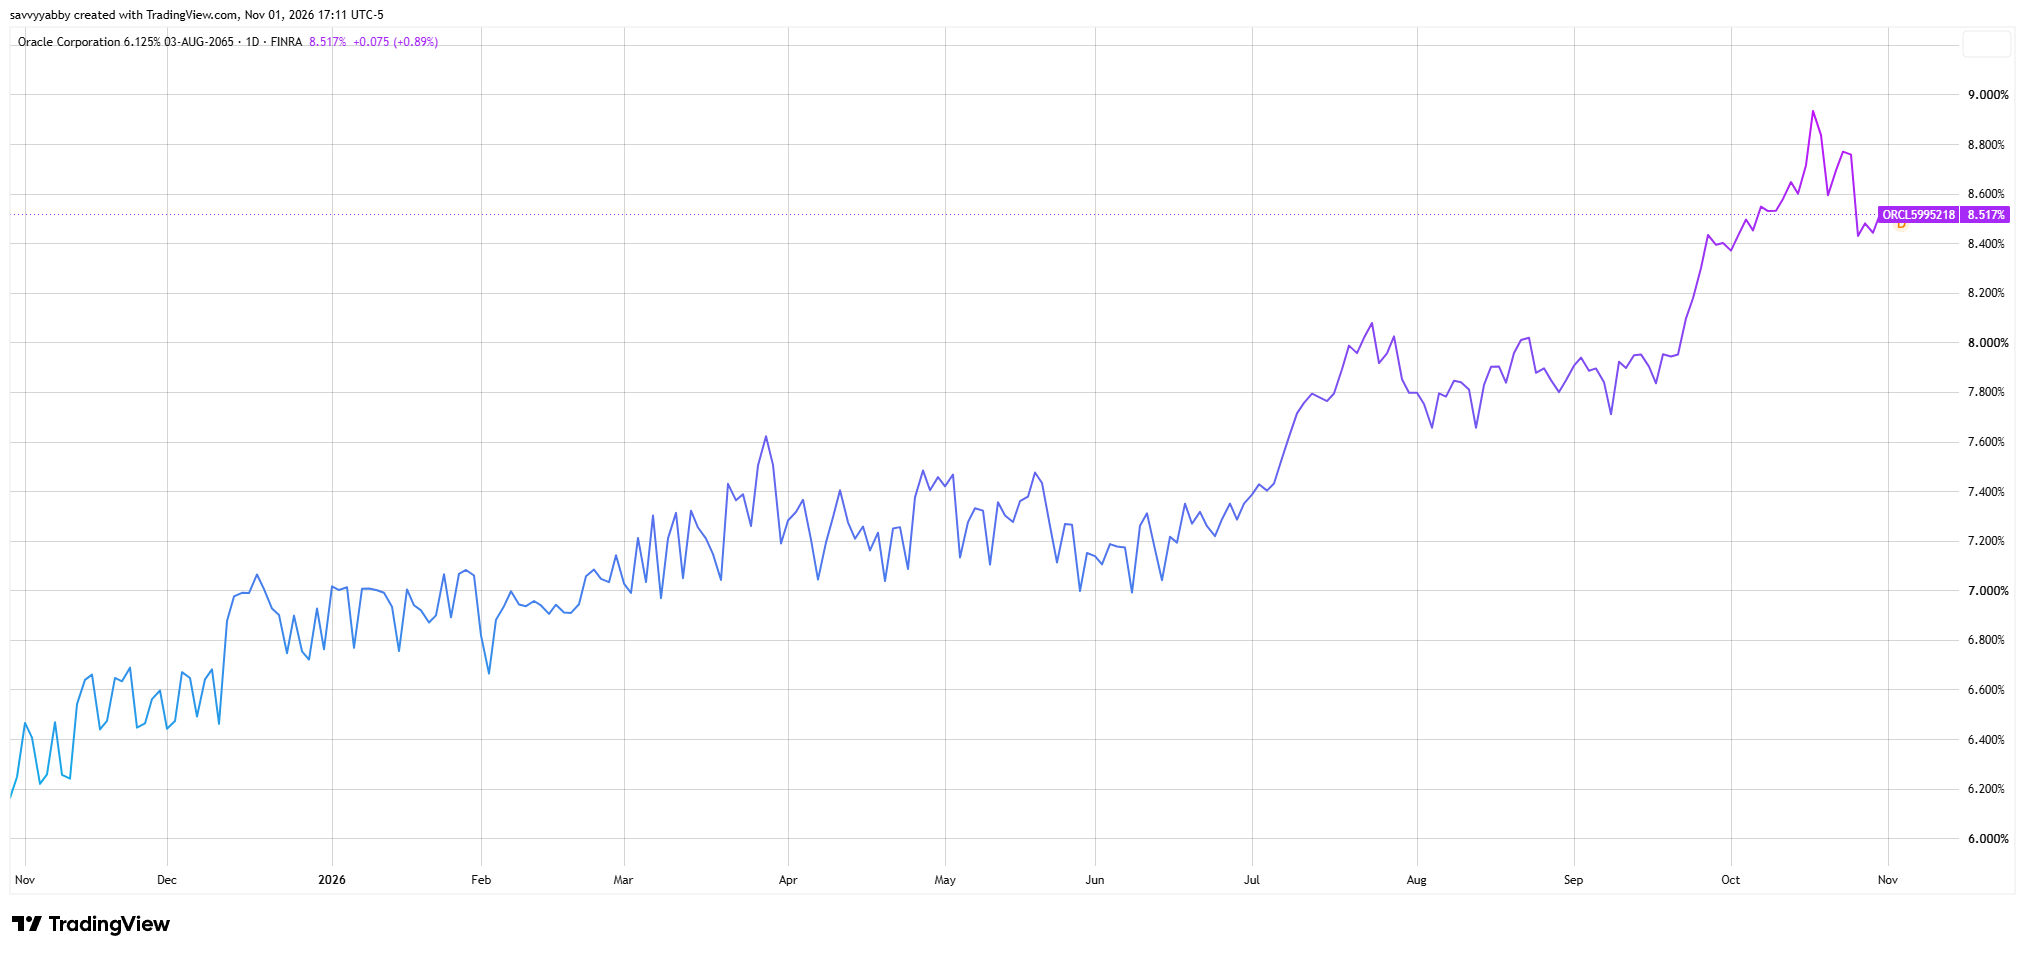
Note that this debt was sold at a coupon of 6.125% one year ago. Oracle still pays that coupon on this tranche of debt, but new dent of similar tenor would cost 8.517%. For the mortgagee that is the equivalent of 2.392% hike in rates.
The analogy to the 19th Century railway boom ought to be clear.
Data centers will not go away but the frenzy may get interrupted.
The problem is that higher interest rates, for the next marginal project, are rising and so the capital expenditure boom will naturally slow down, and even reverse.
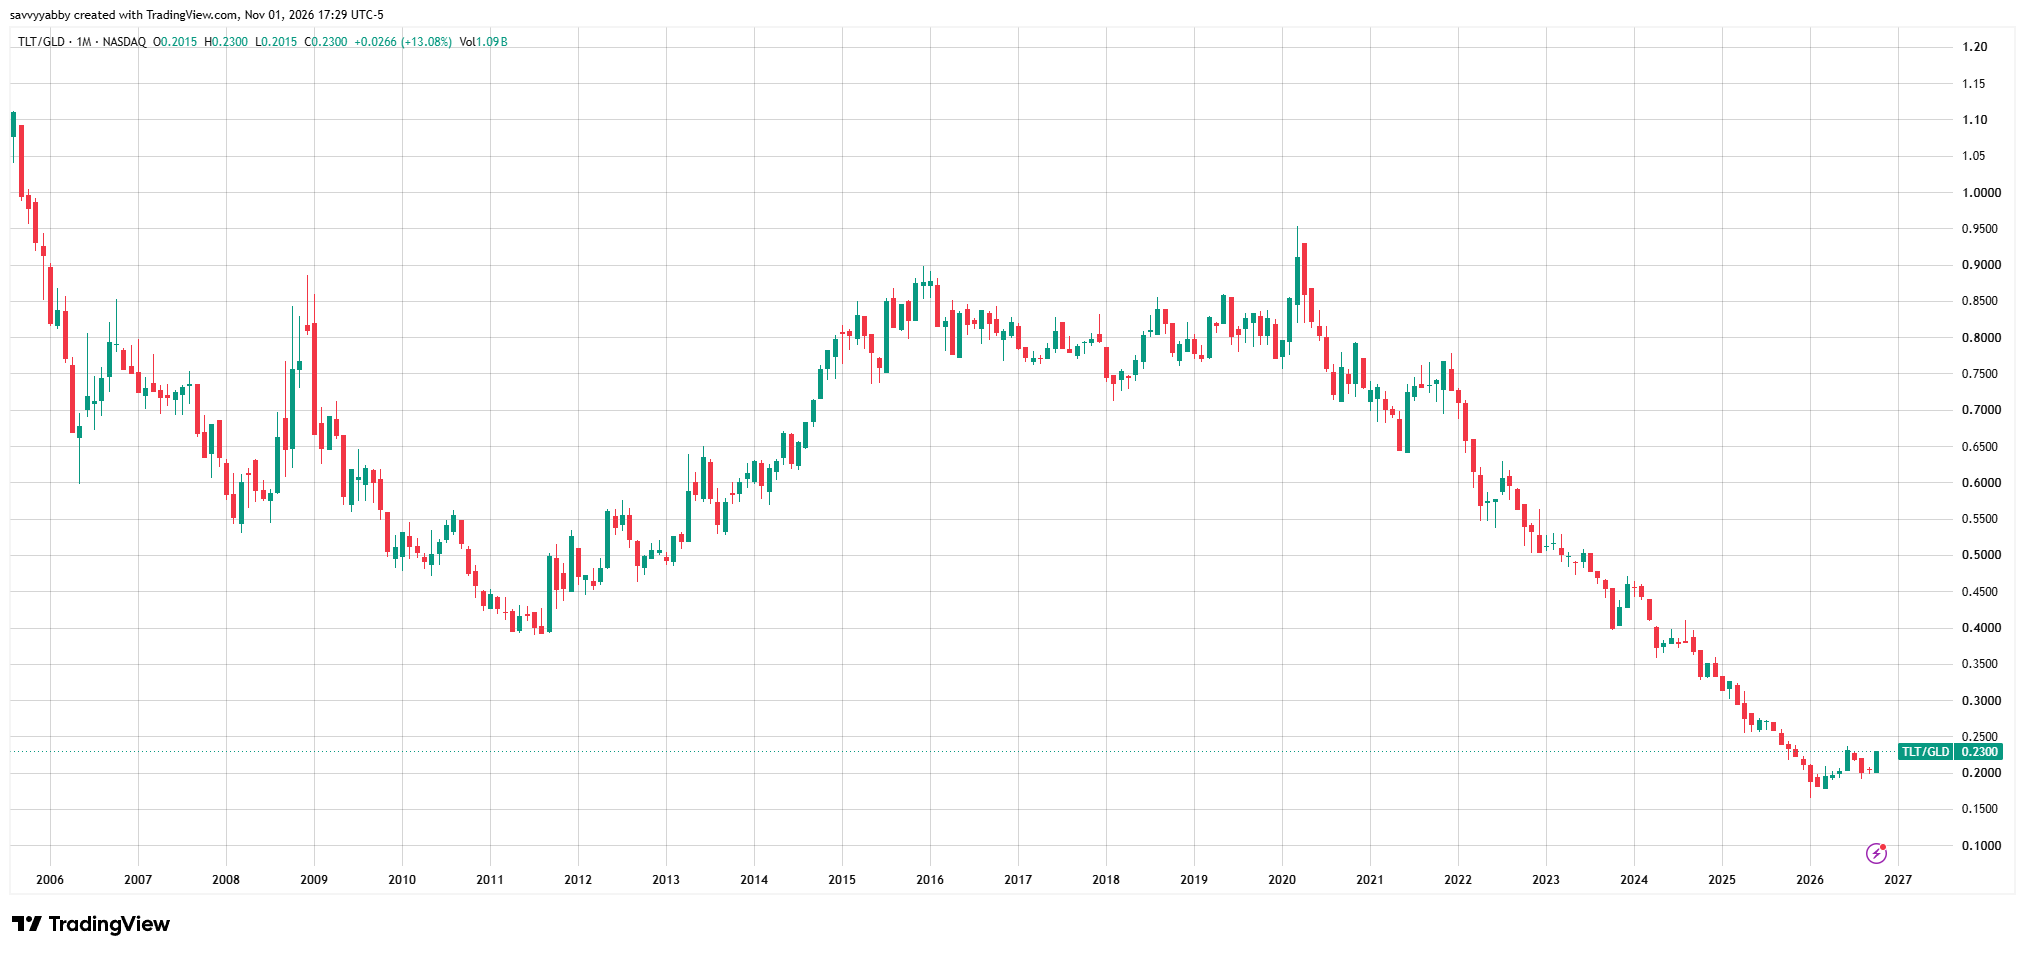
To make this clear, let us look at the Market Schwerpunkt for the US Government. Just like our previous article, we look at the 20+ Year Treasury bond ETF XNAS: TLT and do the price ratio of that, with income reinvested, versus Gold AMEX: GLD.
For completeness, let us look at US Treasury bonds versus the S&P 500 AMEX: SPY.
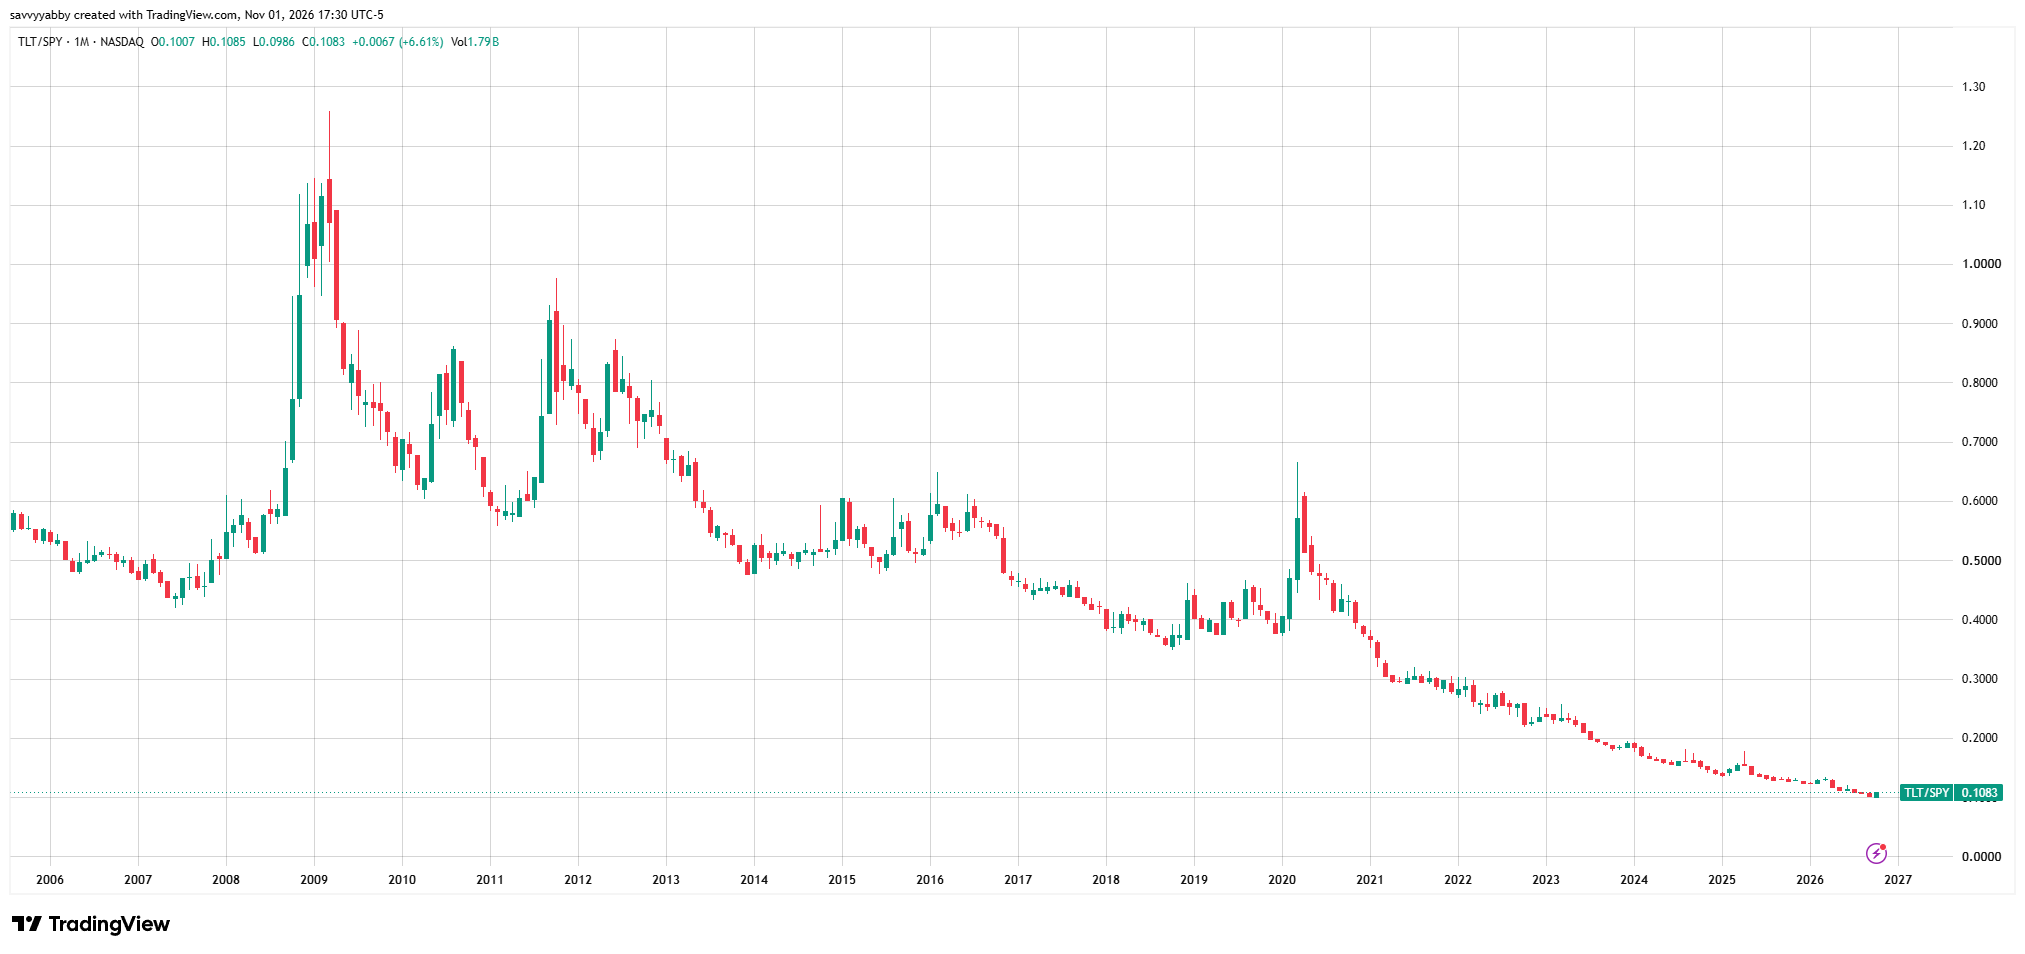
At the margin, I think you can now see where we are headed with portfolios.
Marginally, we should be trimming gold to buy short term US treasuries.
This is because interest rates could rise further and we do not want duration risk. That is the property of bonds where the value is more sensitive to interest rate changes in proportion to the amount of time left to maturity. Famously, this is the property of fixed income measure by Macaulay Modified Duration, after our Fred above.
The eternal lesson of history is that megalomaniacs run out of money.
This is what we call a “capital expenditure cycle” and it is not the end of a secular trend, but a chance to cut a few folks off at the knees and make a buck.
It is the bond market which performs this social function.
They do not do it because they are fine upstanding moral people.
The bond market does this service because they can do math.
Some folks call the bond market the home of the vigilantes.
Personally, and speaking as a former bond guy, I think that this does the people involved a disservice by damming them with faint praise for outsider status.
In my world, the bond market is home of the Visigoth.

Whenever the titans of American finance or government cannot keep their promise to private lenders the Visigoth show up. It is never pretty. They walk off with the silver.
The Visigoth are not here yet, but you can hear their horses coming.
They are coming for Oracle debt, CoreWeave debt, and the debt of any other fool company that is currently flapping in the breeze with giant promises.
For some among us, this is simply a home coming.
I can spar with any Visigoth on the street and trade tips on sword sharpening.
Look on this as the fun time in markets. It is like Conan with Malteezers on tap.
In the meantime, the best thing to do is trade SPY for SHY.
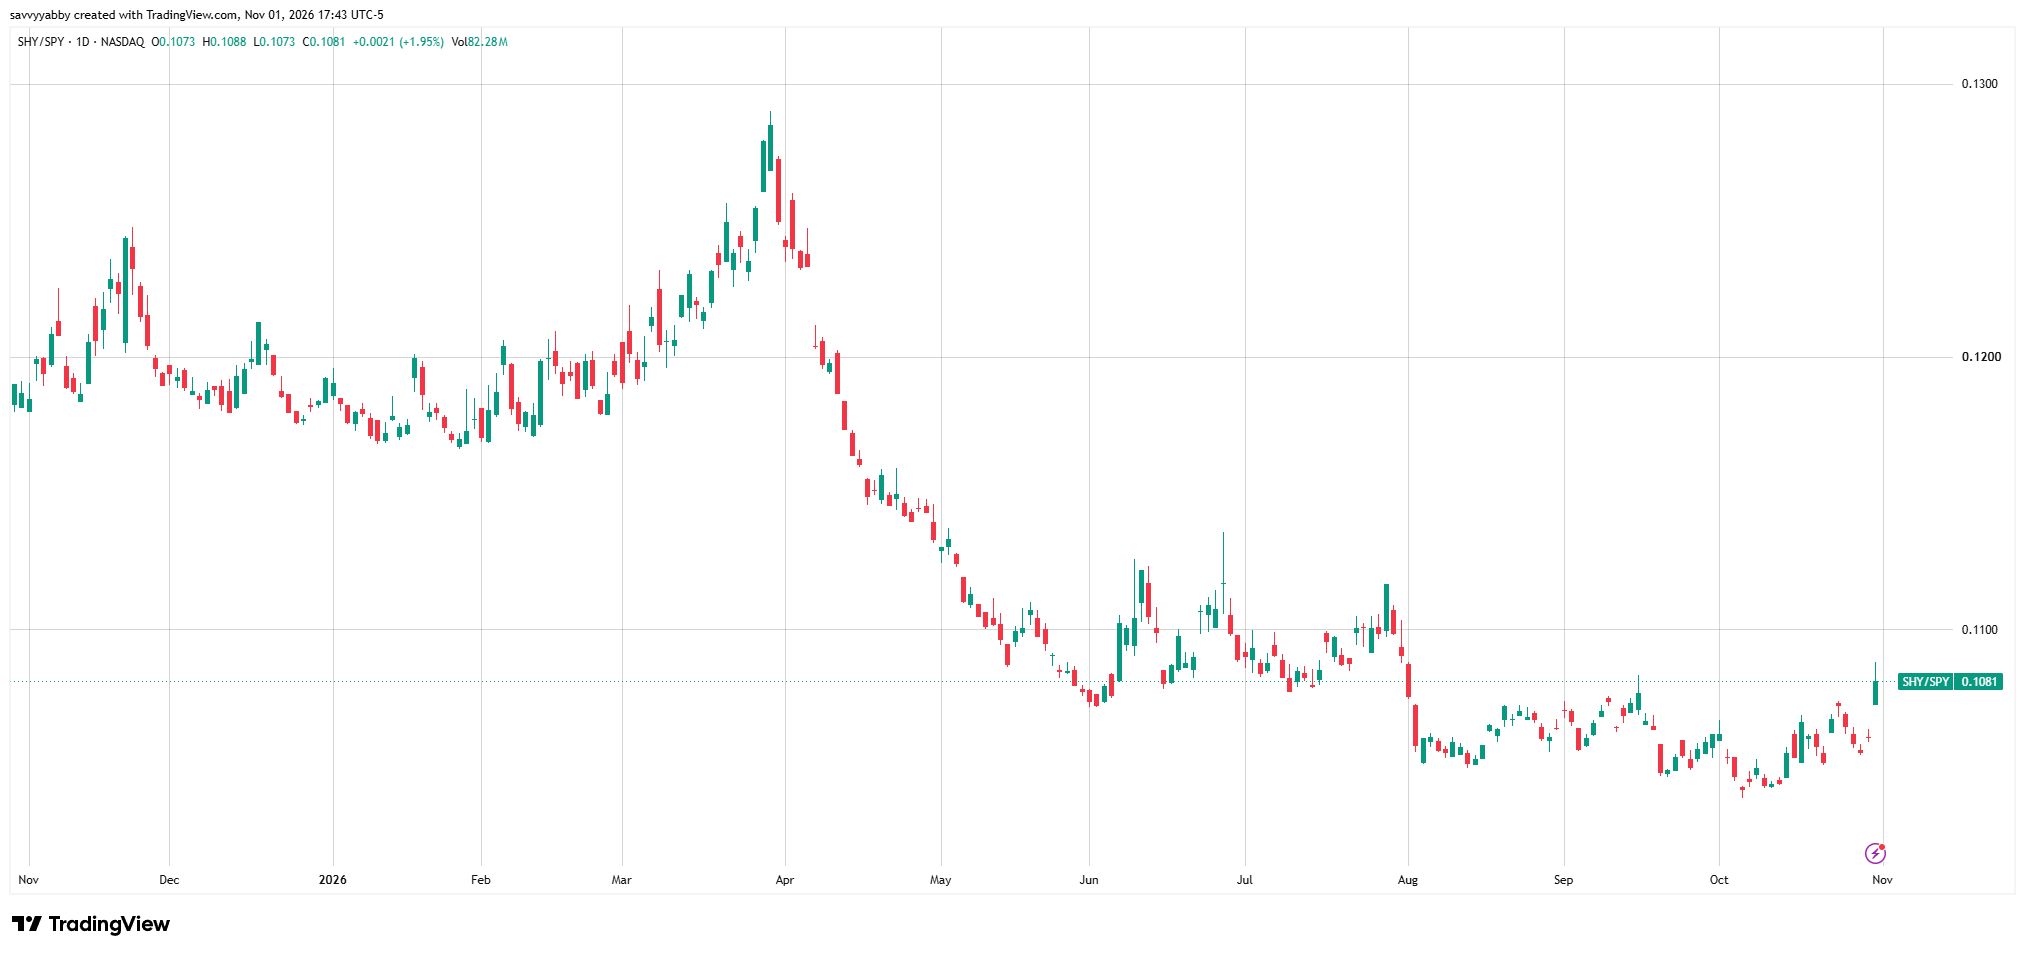
The iShares 1-3 Year Treasury Bond ETF XNAS: SHY is a good place to park cash. Only now does it look like it may outperform the S&P 500.
Simultaneously, we will likely lighten some gold holdings for SHY.
This is a get ready move for when this interest rate cycle turns.
I do not think this will be until 2027.
The megalomaniacs are not properly frightened yet.
They will be when the Visigoth show up in force.
Conclusion
I am busy now boning up on all I forgot about bonds.
This is no time to panic but a good time to barbecue a few wild boars.
The Visigoth know how to throw a party.
A fine one is coming.
Happy investing.